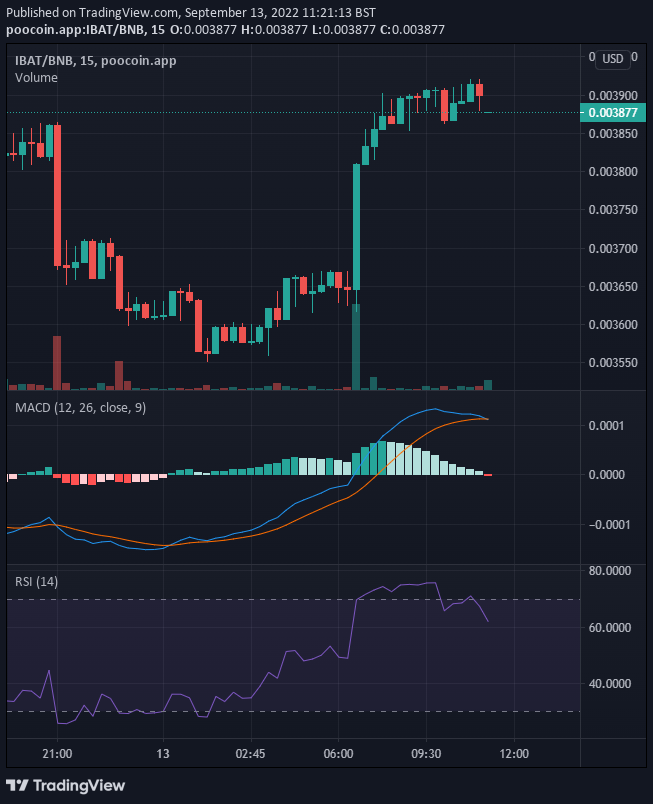
The Bollinger Band indicator helped us yesterday to foretell the imminent upswing (in the price Battle Infinity) that we can now see in the market today. We can observe how the bearish momentum reduced after the candle broke the lower band of the Bollinger band (this is highly significant as it means that the direction of the market will soon give way to an upswing). After the price action reached the support level of $0.003575, it bounced and reach the current price of $0.003877. The reduction in the bullish momentum of IBAT/USD is quickly obvious in a short timeframe. Such price drawbacks may not even reflect on a bigger timeframe. Although bears may be slowing down the bullish momentum, the bullish momentum will still recover.
Key Levels
Resistance: $0.003945, $0.004000, $0.004100
Support: $0.003800, $0.003758, $0.003700
IBAT/USD: The Indicators’ Outlook
At 53% market strength of the RSI line, the market is still considered bullish in trend. In the 11th hour, we can see that sellers came back into the market to resist the upward push of the price by the bulls. To this effect, the Moving Average Convergence and Divergence show a weakening histogram for the 11th-hour session. However, bulls still have the likelihood of continuing the trend soon despite the hurdle that sellers posed against them.

IBAT/USD Short-Term Outlook: Bullish Recovery (15-minute chart)
In this timeframe, the price is ranging sideways as the two pressures are matching against each other. We should expect that after a brief price consolidation, Battle Infinity will find its direction. The RSI line is giving a clue to the possible direction of the crypto and this is to the upside. The RSI line bounced off the 60% boundary line of the indicator and finds a new measurement at 63%. The price will continue to the upside.
Want a coin that has a huge potential for massive returns? That coin is Battle Infinity.
Buy IBAT now.


Leave a Reply