GBP/USD Price Prediction – September 13
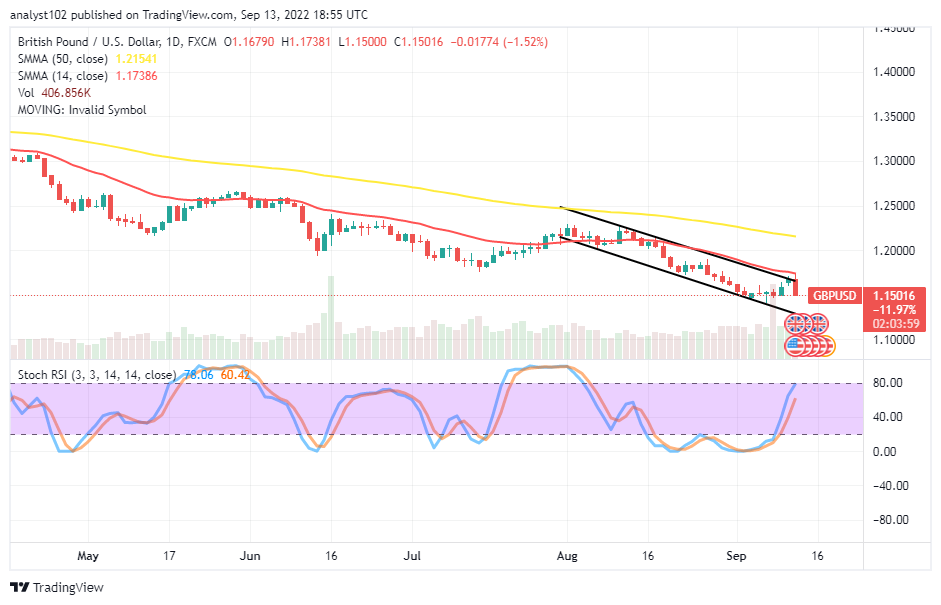
The Great Britain Pound tried to surge higher against the United States of America’s Dollar but tended to lose some pips after reaching a resistance line around 1.1700 recently. As of the time of writing, the price is around the1.52 percent negative, between the high and low of 1.1738 and 1.1500.
GBP/USD Market
Key Levels:
Resistance levels: 1.1700, 1.1800, 1.1900
Support levels: 1.1400, 1.1300, 1.1200
GBP/USD – Daily Chart
The GBP/USD daily chart showcases the currency pair market losing some pips shortly after it tested the smaller SMA trend line. The 50-day SMA indicator is at 1.21541 above the 1.17386 trending point of the 50-day SMA indicator. The bearish channel trend lines drew to mark the path the market has been somewhat keeping around the lowly-scaled SMA. The Stochastic Oscillators have crossed northbound to reach 60.42 and 78.06 range values. Will the AUD/USD market lose more pips in the subsequent sessions?
Currently, a bearish signal is playing out below the trend line of the 14-day SMA to probably create a stem of selling wall just as it has established that the currency pair market has begun to lose some pips. Buyers need to hold back the intention of launching further long positions at the moment.
On the downside of the technical analytics, the GBP/USD market bears may now ride alongside the declining moves as currently featured. However, they need to be wary of an unprecedented rebound that can surface breach the resistance point given around the 14-day SMA at the 1.17386 afterward.
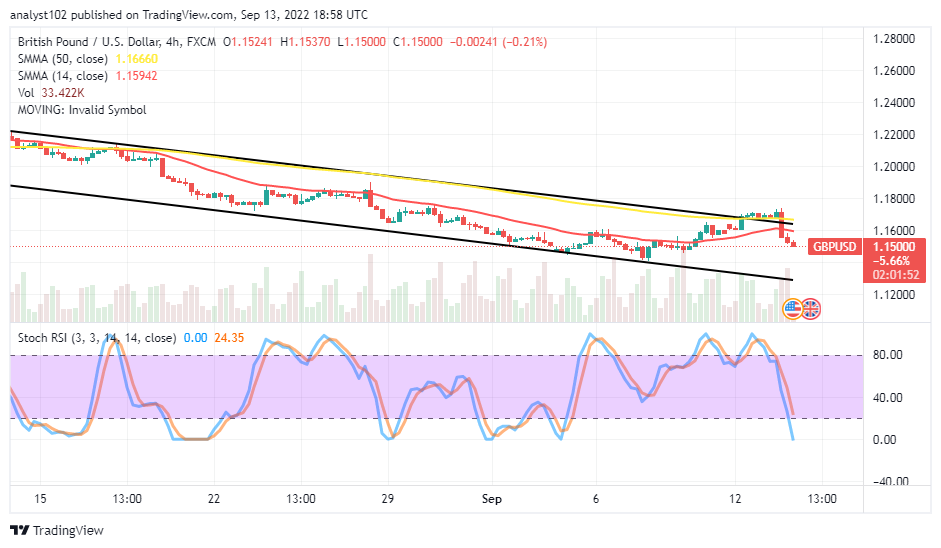
In summary, it shows that sellers can ride profitably for a while, provided the GBP/USD market bulls will remain inactive for some time below the sell signal side of the smaller SMA tool. GBP/USD 4-hour Chart
The GBP/USD medium-term chart portrays the fiat currency pair market losing some pips after it got its energy to push high exhausted at the reach of resistance a bit above the bigger-SMA trend line. The 14-day SMA indicator is at 1.15942, underneath the 50-day SMA indicator, which is at the 1.16660 value line. The Stochastic Oscillators have crossed southbound into the oversold region, positioning at 24.35 and 0.00 range points. That signifies the forces to the downside are gradually ruining into a reduction.
Note: Forexschoolonline.com is not a financial advisor. Do your research before investing your funds in any financial asset or presented product or event. We are not responsible for your investing results.
Learn to Trade Forex Online
GBP/USD Market Loses Some Pips
Footer

ForexSchoolOnline.com helps individual traders learn how to trade the Forex market
WARNING: The content on this site should not be considered investment advice and we are not authorised to provide investment advice. Nothing on this website is an endorsement or recommendation of a particular trading strategy or investment decision. The information on this website is general in nature so you must consider the information in light of your objectives, financial situation and needs.
Investing is speculative. When investing your capital is at risk. This site is not intended for use in jurisdictions in which the trading or investments described are prohibited and should only be used by such persons and in such ways as are legally permitted. Your investment may not qualify for investor protection in your country or state of residence, so please conduct your own due diligence or obtain advice where necessary. This website is free for you to use but we may receive a commission from the companies we feature on this site.
We Introduce people to the world of currency trading. and provide educational content to help them learn how to become profitable traders. we're also a community of traders that support each other on our daily trading journey
Forexschoolonline.com is not a financial advisor. Do your research before investing your funds in any financial asset or presented product or event. We are not responsible for your investing results.

Leave a Reply