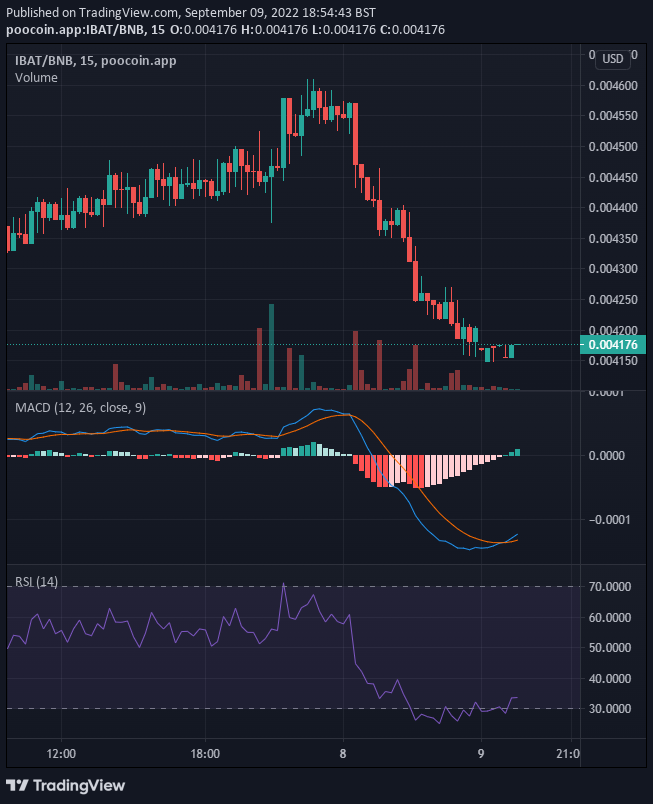
The best time to invest for a profitable future return is when the price of the market falls. Battle Infinity is a type of market that is full of opportunities for traders to make much profit. They just have to be alert and on the watch so that they can spot the right time to enter the trade for a profitable return. Through the help of charts and indicators, we can discover those opportunities. IBAT/USD is presently performing in favour of the bears. But if we look closely at the chart, we can see that the sellers are becoming weaker. The buyers may be preparing to take the market to the upside. The bulls have become strong enough to resist any further down push of the price by bears
Key Levels
Resistance: $0.004278, $0.004400, $0.004500
Support: $0.004148, $0.004111 $0.004077
IBAT/USD: The Indicators’ Outlook
The last two negative histograms of the Moving Average Convergence and Divergence indicator show a market price that is recovering from a lower price level to an upper price level. This is evident in the pink-coloured histograms. Although the MACD line has not yet crossed the signal line, it will soon follow the histograms as the price rises again. The Relative Strength Index line had touched the threshold of the oversold territory, but there is a sign that the line is diverging from the oversold as it is trying to move upward.

Battle Infinity Short-Term Outlook: Bullish Recovery (15-minute chart)
In this shorter timeframe, we can see how the bulls are steadily recovering. The bullish histograms had started to advance in height since yesterday. Although the process of recovery appears slow, it is progressive. As far as the MACD of the 15-minute timeframe is concerned, the market has swung to the upside. But the RSI still points to a weak market as it measures 35%. However, the market is recovering.
Want a coin that has a huge potential for massive returns? That coin is Battle Infinity.
Buy IBAT now.


Leave a Reply