On the 1-hour chart of today’s IBAT/USD trading session, we can see several very bullish candlesticks. Yesterday’s market ended in favour of bears. But towards the last 1 hour of yesterday’s trading session, the selling pressure reduced greatly. At around the last hour of the 24th of August, buying pressure became strong enough to close the price near the point at which bears opened it. As we crossed into the day, bulls dominate the market. Today, there is a very significant candlestick that is appearing at the 8th hour IBAT/USD. That candlestick left a space between itself and the previous candlestick, that is the 7th-hour candlestick. This type of candlestick pattern is very significant. It is a sign of aggression on the part of buyers.
Key Levels
Resistance: $0.005785, $0.005932, $0.006006
Support: $0.005375, $0.004986, $0.004865

Battle Infinity Short-Term Trend: Bearish (15-Minute Chart)
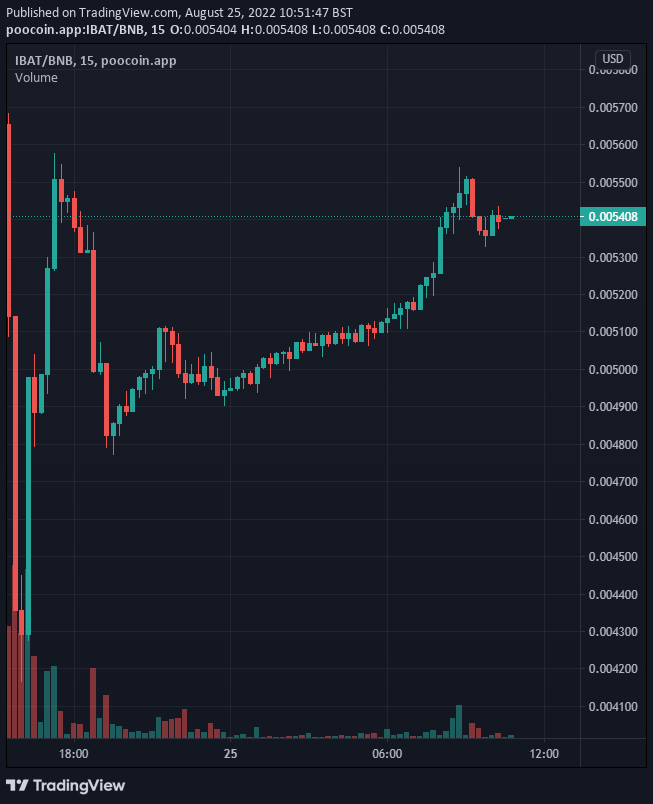
When we scale into the IBAT/USD 15-minute timeframe, we can see the buyers aggressively taking the market. There are very few bearish candles on the chart. This is confirmation of what the 1-hour timeframe says about the market. The market trend is already in favour of bulls.
Battle Infinity: Views From the Indicators
Looking at the Relative Strength Index of the IBAT/USD 15 minutes timeframe, there is a chance that this strong buying pressure may weaken. The RSI indicates that the line has crossed into the overbought zone at around 82%. This may not mean that the price will fall drastically. The price may just correct itself into the strong bullish zone of the indicator. By this, it may just correct its overly strong bullish momentum to a moderate one.
Want a coin that has a huge potential for massive returns? That coin is Battle Infinity.
Buy IBAT now.


Leave a Reply