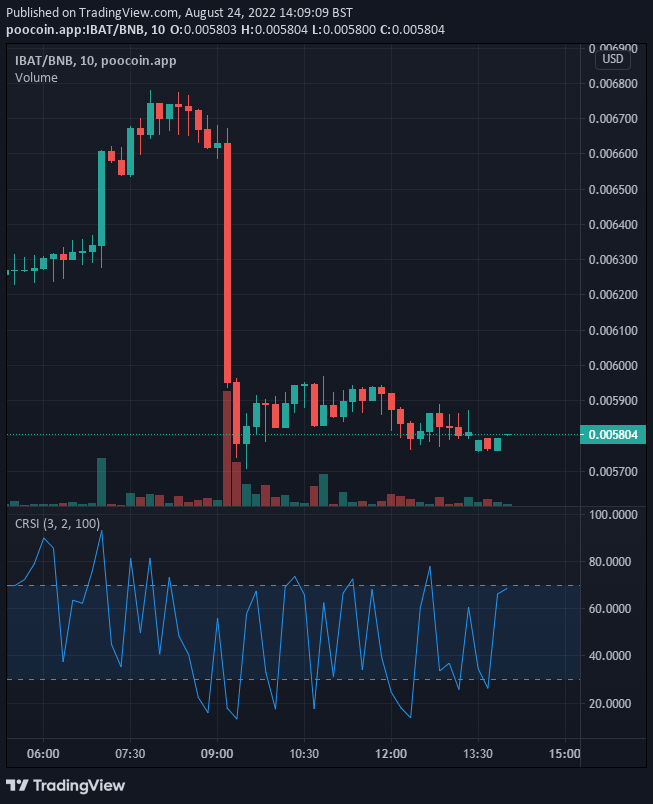
So far in the day’s trading sessions, sellers have brought down the price of this altcoin. This is an opportunity for investors to enter the market, they buy and hold until the price rises. The present fall in the price of the coin helps them to be able to buy more IBAT/USD and hold so that they will be able to make quick returns on them when they sell them at the right time. According to the information on the chart, an Upswing in the price of the coin may be imminent. In the 11th and the 13th trading sessions, we can see that the price actions show that the selling pressure is weakening. On these two occasions we see that in the next session, the buyers take the market.
Key Levels
Resistance: $0.006500, $0.00700, $0.007500
Support: $0.005787, $0.005500, $0.004363
IBAT/USD Short-Term Trend: Bearish (15-Minute Chart)
Looking at this type of timeframe affords us a better chance to be able to anticipate IBAT’s next move. This timeframe reveals that the selling pressure may be reducing. It also reveals that bullish momentum may be increasing in the market. We can see, from this ‘window’ that demand and supply are actively moving the price around. This is a sign that the market is healthy and it has prospects of profit in favour of both the buyers and the sellers. And the price may soon swing to the upside.

IBAT/USD: Views From the Indicators
From the Relative Strength Index, the indicating line is indeed in the weak zone, the indicator line shows that the strength of the market is on the rise. It is measuring around 40% ready to cross into the stronger zone of the indicator. In the Moving Average Convergence and Divergence, the histogram of the MACD is on the negative side, but the pink histogram shows that the price of IBAT/USD is rebounding.
Want a coin that has a huge potential for massive returns? That coin is Battle Infinity.
Buy IBAT now.


Leave a Reply