GBP/USD Price Prediction – August 15
About a week ago, the GBP/USD market resorted to a correction, and the currency pair price holds a valuation below the 1.2200 resistance line. The market is trading around 1.2131 at an average percentage rate of 0.55 negative.
GBP/USD Market
Key Levels:
Resistance levels: 1.2200, 1.2300, 1.2400
Support levels: 1.2000, 1.1900, 1.1800
GBP/USD – Daily Chart
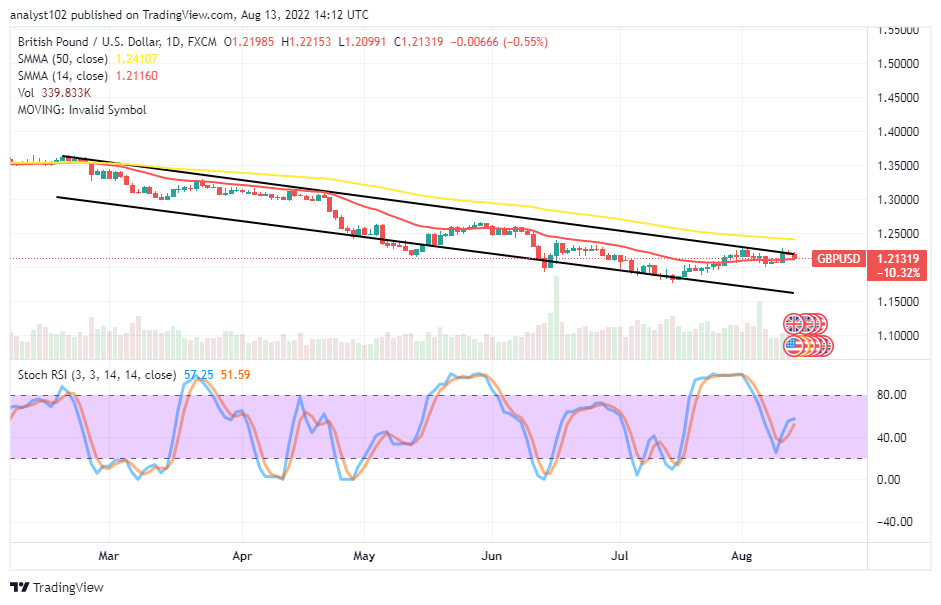
The GBP/USD daily chart reveals price holds a valuation below the 1.2200 resistance level. The 50-day SMA indicator is at 1.24107 above the 14-day SMA indicator, which is at the 1.21160 value line. In the long-term running outlook, the trend looks bearish as the bearish channels have drawn, marking out zones that the downward-trending forces have maintained over time. The Stochastic Oscillators have moved southbound to reposition at 51.59 and 57.25 range lines. Will the GBP/USD market debase around the upper bearish trend line soon?
An indication is now suggesting the GBP/USD market operation may debase around the upper bearish trend line in no time as the currency pair price holds a valuation below the 1.2200 resistance level. At this time of analytics write-up, long-position placers would have to exercise patience until the market tends to resettle for another pattern to portend a completion of a downward motion below the trend lines of the SMAs afterward.
On the downside of the technical, the GBP/USD market bears seem to be garnering energy beneath the resistance trend line of 1.2200. A pull-up needed to occur and turn out fake toward the value line to allow price resort to an active reversal-moving mode.
In summary, selling activities need to be intensified below the 1.2200 resistance level. However, if an upward-gap movement occurs, the sellers may have to restage a come-back around the trend line of the 50-day SMA at 1.24107. GBP/USD 4-hour Chart
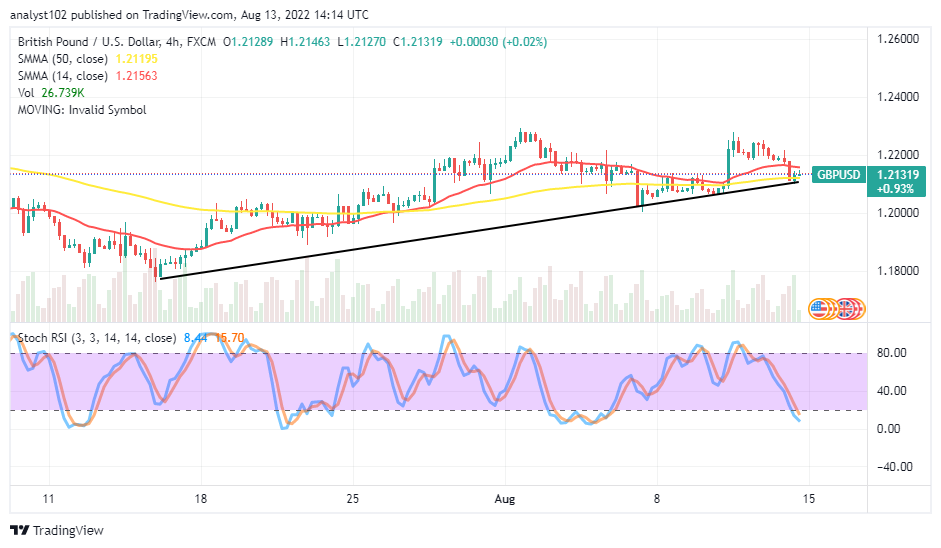
The GBP/USD medium-term chart shows the currency pair market is holding a valuation below in a bullish outlook below the 1.2200 resistance level. The 14-day SMA indicator is at 1.21563 above the 1.21195 points of the 50-day SMA indicator. The Stochastic Oscillators have crossed southbound from around the 80 range to 15.70 and 8.44. And that signifies the market is trading in an oversold region as o the time of writing. A resurface of a bullish candlestick at the moment may push the price upward back to revisit previous higher resistances.
Note: Forexschoolonline.com is not a financial advisor. Do your research before investing your funds in any financial asset or presented product or event. We are not responsible for your investing results.


Leave a Reply