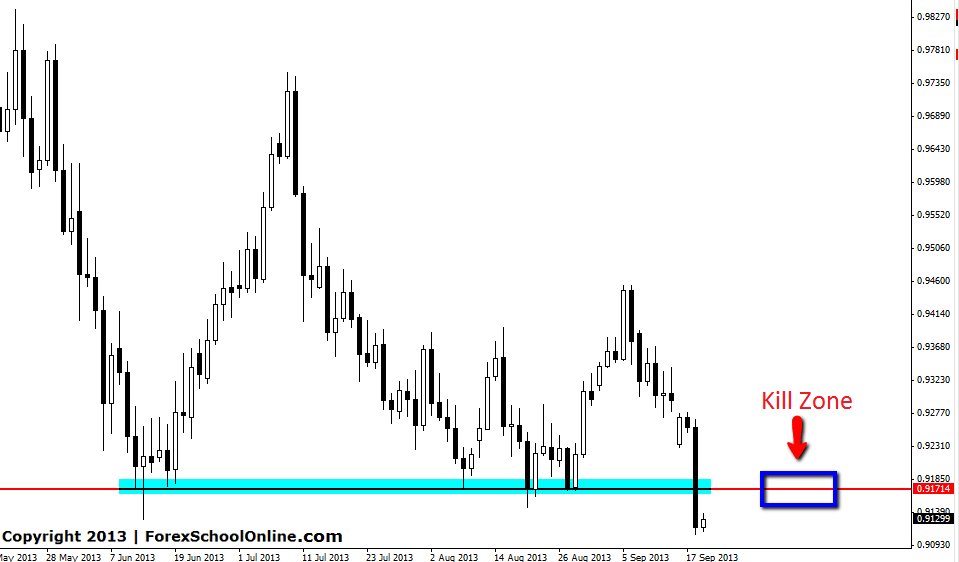
Price has smashed through a key support level on the daily price action chart of the USDCHF and closed well lower, near to the daily lows. The size of this move lower is close to 160 pips, which is quite a large move lower for this pair and one of the largest candles on the daily chart.
Price has now moved through support and this level could now act as a price flip area and act as a new key resistance area. This area is also known as a “Kill Zone” and traders can begin targeting short trades if price moves back into this area. Traders can look for short trades on their intra day charts such as 8hr and 4hr charts if any solid short price action signals start presenting.
Often when price moves so strongly like it has here, it wont retrace or pull-back to a key level, but will instead just continue on. Traders in this scenario can look for continuation trades if price is looking to just continue and not retrace at all.
USDCHF DAILY CHART

SPECIAL NOTE: I have just released a brand new article. This article can be found here: Can Successful Forex Trading Be Taught? This article looks at whether successful Forex trading can be taught or not and also goes into some tips and tricks to help you in your journey to becoming a trader.


Leave a Reply