AUD/USD Price Prediction – May 30
Over a couple of days back, the AUD/USD market has been witnessing its moves in a rallying motion from the depth of a lower-trading spot. The currency pair trade has lost about 41 pips at it trades between 0.7193 and 0.7152 at a 0.40 percent rate positive.
AUD/USD Market
Key Levels:
Resistance levels: 0.7300, 0.7400, 0.7500
Support levels: 0.7100, 0.7000, 0.6900
AUD/USD – Daily Chart
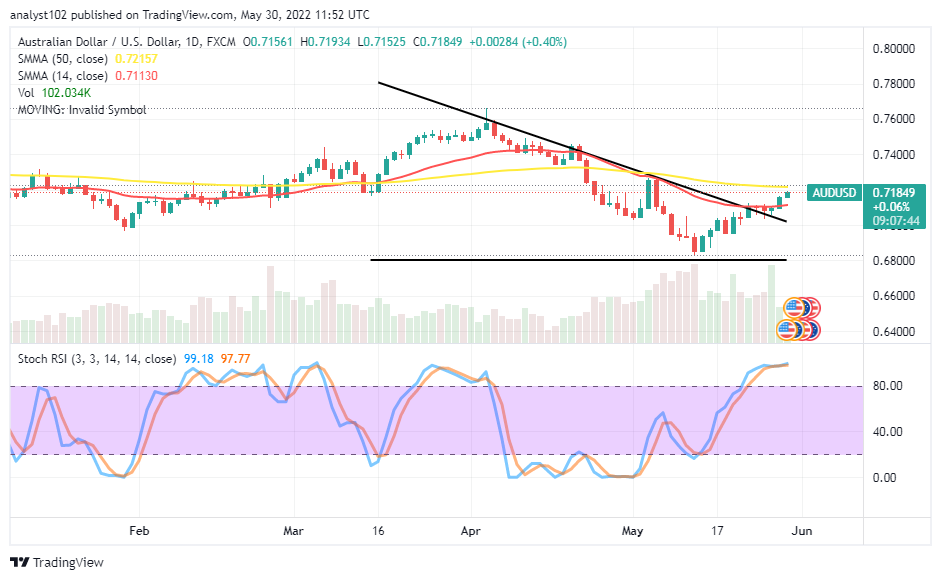
The daily chart reveals the AUD market moves in a rallying motion against the purchasing power of the US Dollar. Variant bullish candlesticks have emerged from a close location above a support level at 0.6800, breaking northward past the smaller SMA to near the bigger SMA from beneath. The 50-day SMA indicator is above the 14-day SMA indicator. The Stochastic Oscillators are in the overbought region, clogging the lines to indicate an ongoing buying force prevails. Will the AUD/USD market gets heightening in its rallying motion?
There can be a pit stop soon around 0.7200 to allow the AUD/USD market determines the next direction to push afterward. Long-position takers would have to add more to their strength around that value point in a consolidation moving manner to breach it for an upward recovery.
On the downside of the technical analysis, it has again shown on the trading chart that the currency pair market has reached an overbought-trading condition around 0.7200. And that calls for sellers’ attention to brace up for an entry that can emanate from a reversal pattern around the point in no time before considering a selling order afterward.
The analytics, at a glance, the AUD/USD market has embarked upon a rallying motion to now face a tough-trading moment as it trades under an overbought condition that can lead to a correction to let sellers make the advantage of around the 0.7200. AUD/USD 4-hour Chart
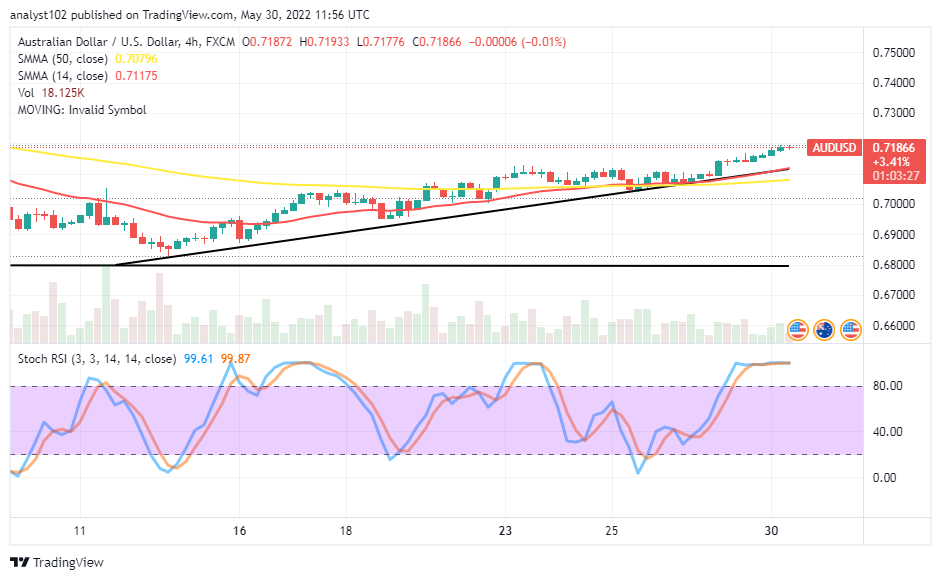
The AUD/USD medium-term chart showcases the currency pair market moves in a rallying motion as a bullish trend line drew to markup the path price maintains to the upside. The 14-day SMA indicator has intercepted the 50-day SMA indicator to the north side. And they are closely beneath the current trading spot. The stochastic Oscillators are in the overbought region, clogging the lines within. That signifies the forces to the upside risk losing in the near time if bulls do not consolidate their efforts to push further past the 0.7200 level in the subsequent operations.
Note:Forexschoolonline.com is not a financial advisor. Do your research before investing your funds in any financial asset or presented product or event. We are not responsible for your investing results.


Leave a Reply