GBP/USD Price Prediction – May 17
The GBP/USD market attempts o make a recovery on a higher note from the depth of a lower trading zone following some sessions of downing in the recent past. The rate of recovery motion is at a positive percentage of 1.16.
GBP/USD Market
Key Levels:
Resistance levels: 1.2600, 1.2800, 1.3000
Support levels: 1.2300, 1.2100, 1.1900
GBP/USD – Daily Chart
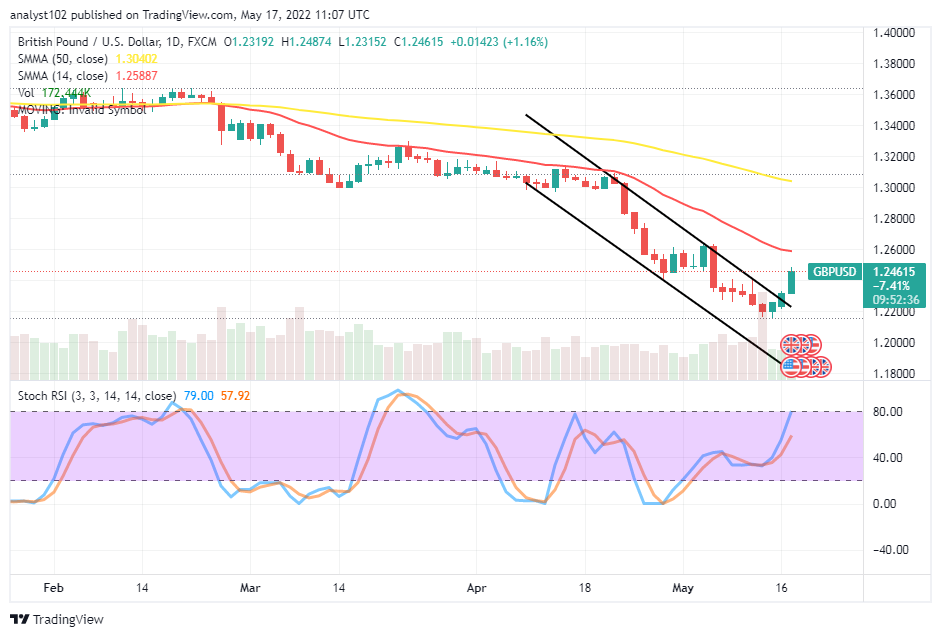
The GBP/USD daily chart showcases the currency pair attempts to make a recovery in the last three days until the present. The 14-day SMA trend line has gone southward beneath the 50-day SMA to widen the gap above the current trading spot. The upper bearish has breached to the upside below the smaller SMA. The Stochastic Oscillators have crossed northbound from beneath the range of 40 closely to the 80 range line, signifying that a buying pressure is ongoing. Will the GBP/USD price succumb to a downward pressure, getting to the 1.2600 resistance?
The 1.2600 resistance level appears to be the barrier against getting a sustainable upward rise in the valuation of the pairing fiat coins. Currently, bulls are in the fast pushing mode to exhaust the upward gathering momentum from the depth of the lower trading zone beneath the SMA trend lines.
On the downside of the technical analysis, the GBP/USD market short-position takers needed to exercise some degrees of patience, as indicated by the formation of a set of bullish candlesticks over a couple of fewer days back. A sudden breakthrough the 1.2600 will potentially negate the expectation of getting an early sell order afterward.
Summarily, the GBP/USD market operations are currently on the verge of full recovering motion in the long-term run. Traders are to be conservative at all points of their position ordering. The top retarding spot to farther ups is at 1.2600. GBP/USD 4-hour Chart
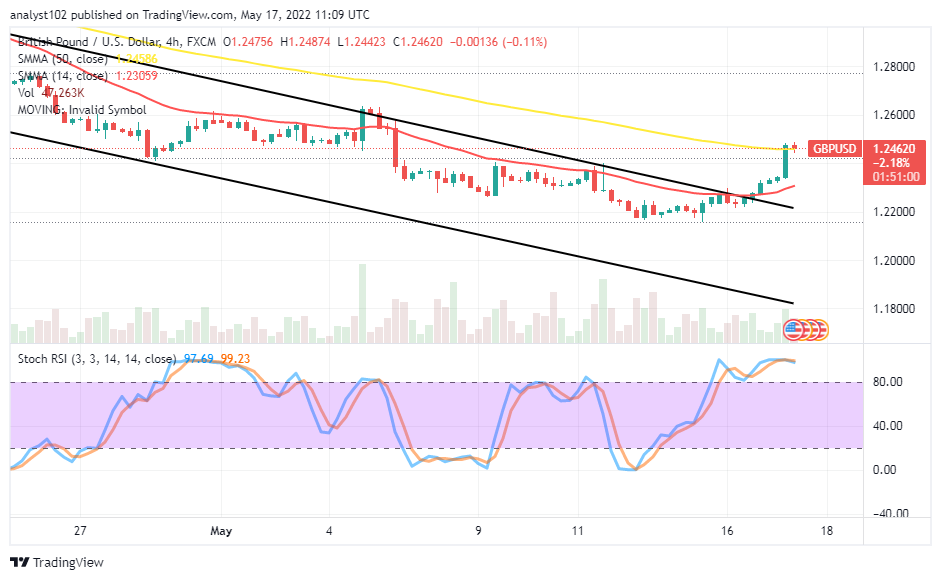
The GBP/USD medium-term chart showcases the pairing currency attempts to make a recovery as it has traded northwardly past the smaller SMA to reach the bigger SMA at the top. The 14-day SMA indicator slightly bends to the north side beneath the 50-day SMA indicator. The Stochastic Oscillators are in the overbought region, moving in consolidation style to denote that a buying force is somewhat ongoing at the moment. under a systemic selling force
Note: Forexschoolonline.com is not a financial advisor. Do your research before investing your funds in any financial asset or presented product or event. We are not responsible for your investing results.
Learn to Trade Forex Online
GBP/USD Market Attempts to Make a Recovery
Footer

ForexSchoolOnline.com helps individual traders learn how to trade the Forex market
WARNING: The content on this site should not be considered investment advice and we are not authorised to provide investment advice. Nothing on this website is an endorsement or recommendation of a particular trading strategy or investment decision. The information on this website is general in nature so you must consider the information in light of your objectives, financial situation and needs.
Investing is speculative. When investing your capital is at risk. This site is not intended for use in jurisdictions in which the trading or investments described are prohibited and should only be used by such persons and in such ways as are legally permitted. Your investment may not qualify for investor protection in your country or state of residence, so please conduct your own due diligence or obtain advice where necessary. This website is free for you to use but we may receive a commission from the companies we feature on this site.
We Introduce people to the world of currency trading. and provide educational content to help them learn how to become profitable traders. we're also a community of traders that support each other on our daily trading journey
Forexschoolonline.com is not a financial advisor. Do your research before investing your funds in any financial asset or presented product or event. We are not responsible for your investing results.

Leave a Reply