GBP/USD Price Prediction – April 19
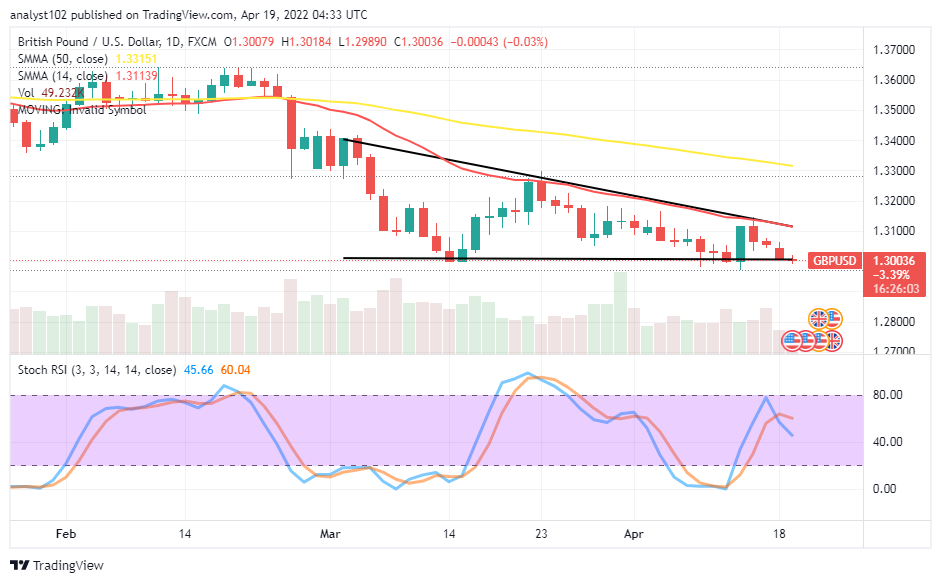
A critical baseline has been overly observed at the trading line at 1.3000 as the currency pair trade activity features around it. The business operation records a minimal negative percentage of 0.03 as price trades between 1.3018 and 1.2989.
GBP/USD Market
Key Levels:
Resistance levels: 1.3100, 1.3200, 1.3300
Support levels: 1.2900, 1.2800, 1.2700
GBP/USD – Daily Chart
The GBP/USD daily chart reveals the currency-pair trade activity features at 1.3000. In the long-term run, it would be technically ideal to wait for the market’s reactions to determine a definite direction out of its current trading outlook in the descending triangular trading formation. The 14-day SMA trend line is alongside the bearish trend line drawn underneath the 50-day SMA trend line. The Stochastic Oscillators have crossed the lines southbound closer to the range at 40. It indicates the appearance of a declining force in the coin pair transactions.
Will there be more downs beyond the 1.3000 as the GBP/USD trade activity features around it?
A sudden breakdown at the 1.3000 will probably give room for more downs as the GBP/USD trade features frequently around it. In the event of that presumption playing out, bulls will have to wait for a re-occurrence of a bullish candlestick at a lower trading spot before considering a buying order afterward.
On the downside of the technical analysis, the GBP/USD market bears have to continue to hold their positions firm underneath the trading resistant barrier of 1.3100. A pull-up away from the 1.3000 support baseline may allow the price to head northward for a retest of the resistance line before returning toward moving past the value-line latterly mentioned.
Summarily, the GBP/USD market operations may stay within the current descending triangular pattern. Therefore, traders needed to focus on 1.3100 and 1.3000 trading spots. GBP/USD 4-hour Chart
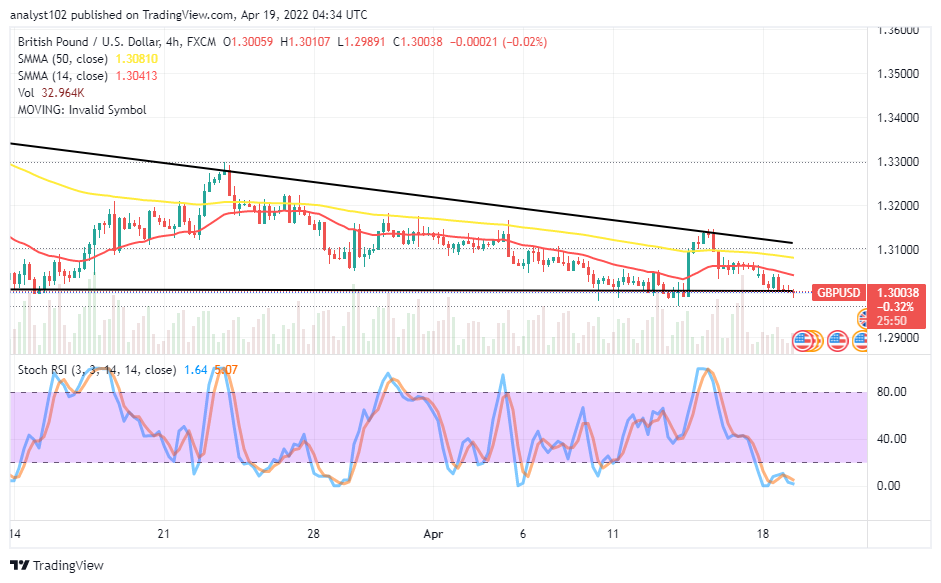
The GBP/USD medium-term chart reveals the currency-pair trade activity features at 1.3000. The 50-day SMA indicator is above the 14-day SMA indicator. The horizontal line drew at 1.3000, showcasing it as the critical level to seeing more downs. The Stochastic Oscillators are in the oversold region, attempting to resume moving in a consolidation. Traders intending to go for shorting orders at this point are to be wary of such decisions. It would be ideally technical to shelve the opinion for a while to avoid unnecessary traps by bears.
Note: Forexschoolonline.com is not a financial advisor. Do your research before investing your funds in any financial asset or presented product or event. We are not responsible for your investing results.
Learn to Trade Forex Online
GBP/USD Trade Activity Features at 1.3000
Footer

ForexSchoolOnline.com helps individual traders learn how to trade the Forex market
WARNING: The content on this site should not be considered investment advice and we are not authorised to provide investment advice. Nothing on this website is an endorsement or recommendation of a particular trading strategy or investment decision. The information on this website is general in nature so you must consider the information in light of your objectives, financial situation and needs.
Investing is speculative. When investing your capital is at risk. This site is not intended for use in jurisdictions in which the trading or investments described are prohibited and should only be used by such persons and in such ways as are legally permitted. Your investment may not qualify for investor protection in your country or state of residence, so please conduct your own due diligence or obtain advice where necessary. This website is free for you to use but we may receive a commission from the companies we feature on this site.
We Introduce people to the world of currency trading. and provide educational content to help them learn how to become profitable traders. we're also a community of traders that support each other on our daily trading journey
Forexschoolonline.com is not a financial advisor. Do your research before investing your funds in any financial asset or presented product or event. We are not responsible for your investing results.

Leave a Reply