USDCHF Analysis – Price Crashes to Its Uptrend Line at 0.92190
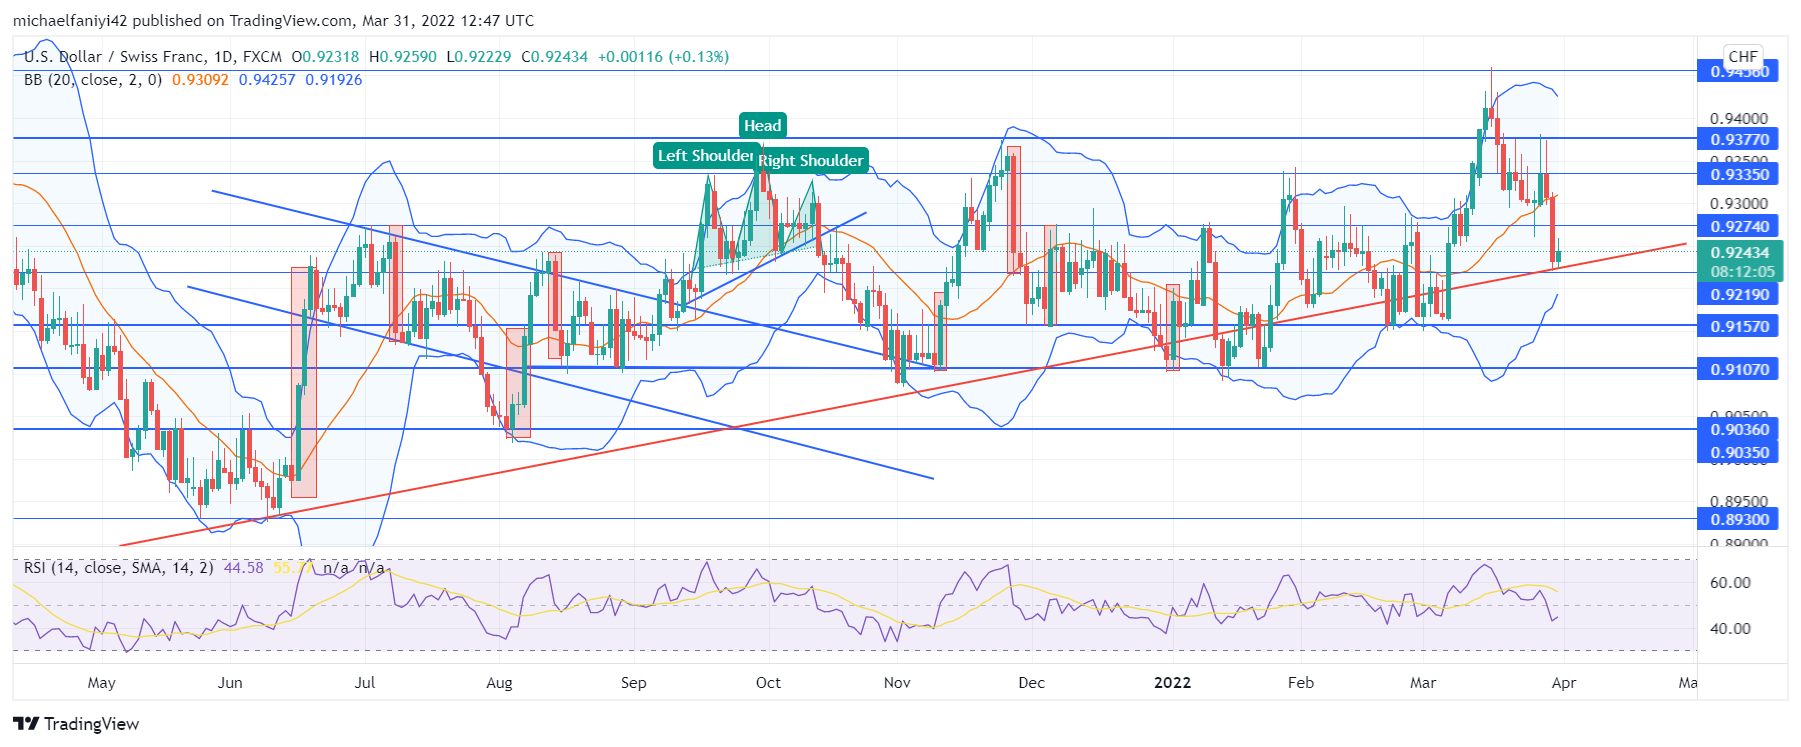
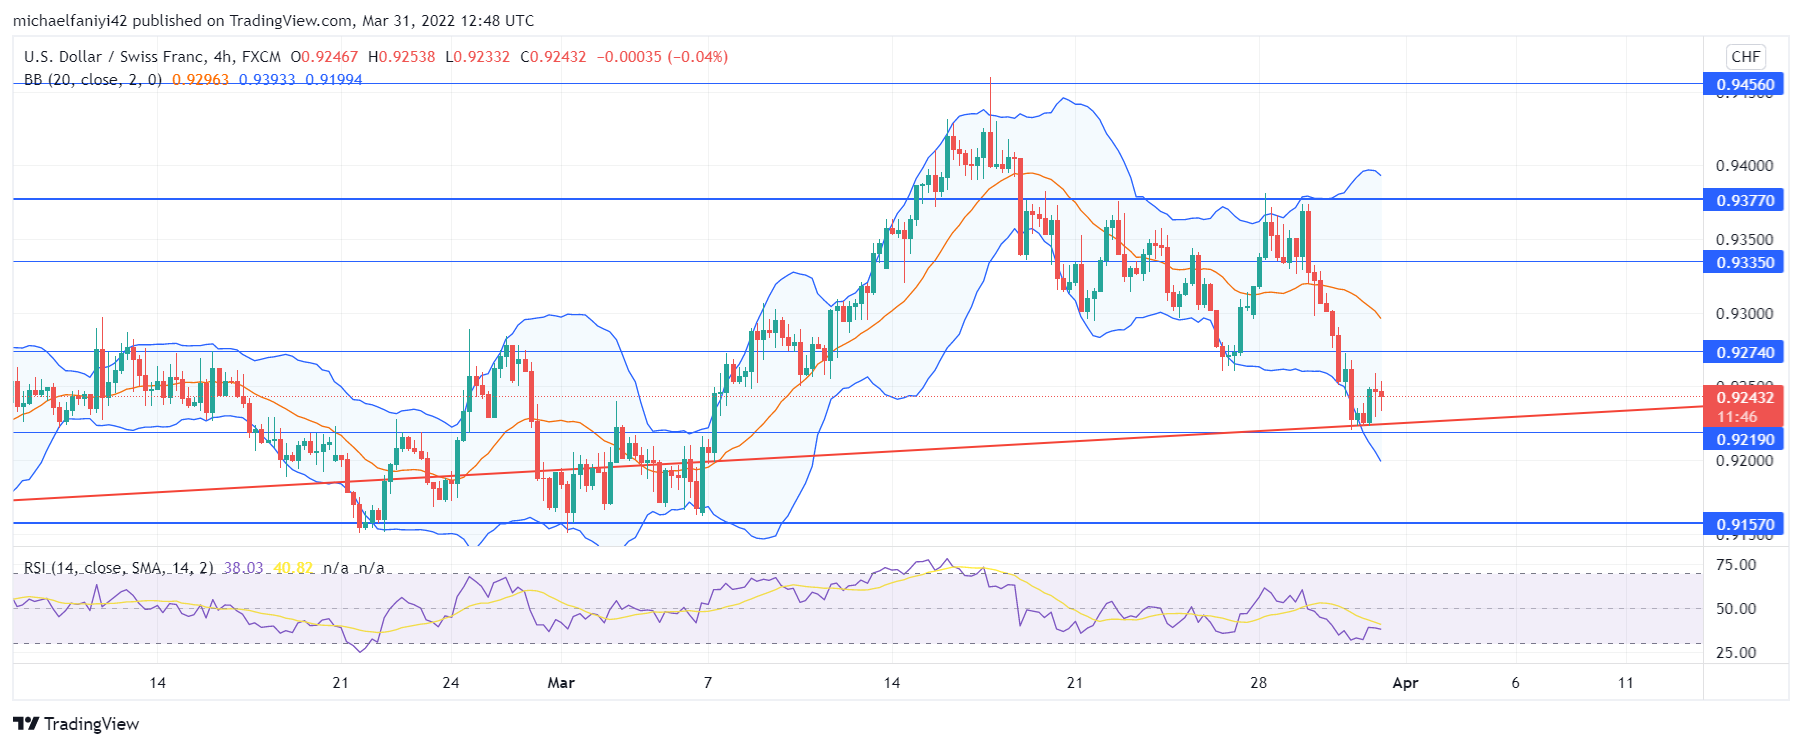
USDCHF crashes to its uptrend line around the 0.92190 significant level. Having attained the highest point they had around April last year, the buyers became exhausted and began dropping. All attempts to revive the price were blocked at 0.93770 and 0.93350, respectively. USDCHF then crashes back to its trend line, which confluences with the 0.92190 support level to start a resurgence.
USDCHF Major Zones
Resistance Levels: 0.94560, 0.93770, 0.93350
Support Levels: 0.92190, 0.91570, 0.91070 USDCHF has been struggling to tag along with its uptrend line. This is chiefly due to the pressure on the price from above. As a result, when the market crashes to the trendline, it tends to drop below it before recovering above it again. This trend was especially prominent in early January and late February to early March. Nevertheless, the currency pair maintains an upward trend.
USDCHF is also set to stabilize itself. The drop of the market to the trendline has been more gentle this time around. The appearance of a bullish candle as the price crashes to the trend line indicates that the market will recover quickly. The slump in the price has plunged the RSI (Relative Strength Index) line below the zero level, but an upward bend at the tip of the line shows immediate recovery.
 Market Expectations
In the 4-hour time frame, reversal candlesticks can be readily observed, including the Doji candlestick. In addition, the candles are pushing hard against the lower band of the Bollinger Band, which means that the price is set to spring upward. The first point of call for the market will be to test the 0.93770 resistance level.
Note: Forexschoolonline.com is not a financial advisor. Do your research before investing your funds in any financial asset or presented product or event. We are not responsible for your investing results.


Leave a Reply