AUD/USD Price Prediction – March 21
It appears 0.7400 has to be a vital point against some of the increases in the AUD/USD trade operations as the currency pair market swings high to hover around it. The trading activities open around 0.7404 to trade between 0.7424 and 0.7394 values at a minimal negative percentage of 0.26.
AUD/USD Market
Key Levels:
Resistance levels: 0.7500, 0.7600, 0.7700
Support levels: 0.7300, 0.7200, 0.7100
AUD/USD – Daily Chart
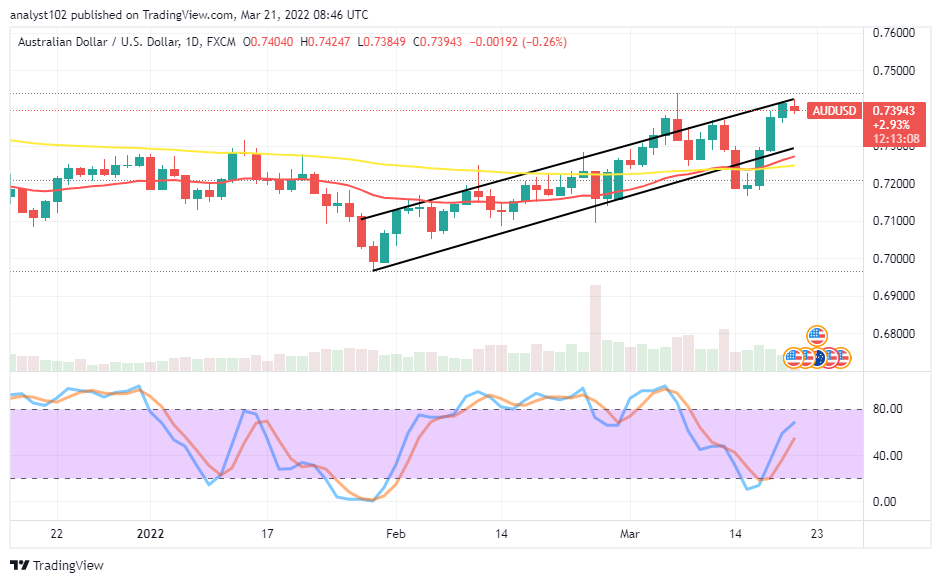
The AUD/USD daily chart shows the currency pair market swings high to hover at 0.7400. On March 14th, trade witnessed a dominance of bears’ impact on the market. But, the following trading day saw a slight bullish candlestick that signaled the return of upward swings until the March 18th session while the price moved back to a previously higher point around the value-line mentioned earlier. The 14-day SMA indicator has I intercepted the 50-day SMA from the below. And they are within the values of 0.7300 and 0.7200 underneath the current trading zone. The Stochastic Oscillators are seemingly attempting to cross their lines at the range of 70.  Will there be a repeat of the AUD/USD trade losing momentum around 0.7400 as the market swings high back from a lower level?
Technically, there may be a repeat of the AUD/USD trade losing momentum around 0.7400 if bulls fail to push harder more at that level as the currency pair market swings high to hover around the value-line presently. Price has to hold firmly against any visible reversal around that point to gain more strength to the upside.
On the downside of the technical analysis, the AUD/USD market bears now needed to gear up to spot any price rejection movement possibility around beneath 0.7500 resistance level before considering a sell order. Traders should always abide by the principles of not introducing higher lot sizes.
The analytics, at a glance, reveals the AUD/USD trade operations now bounce back into an overbought trading region, showing 0.7400 as the main value-line over time. Likely, the currency pair market will soon be losing momentum as it did in the past at that trading capacity zone. AUD/USD 4-hour Chart
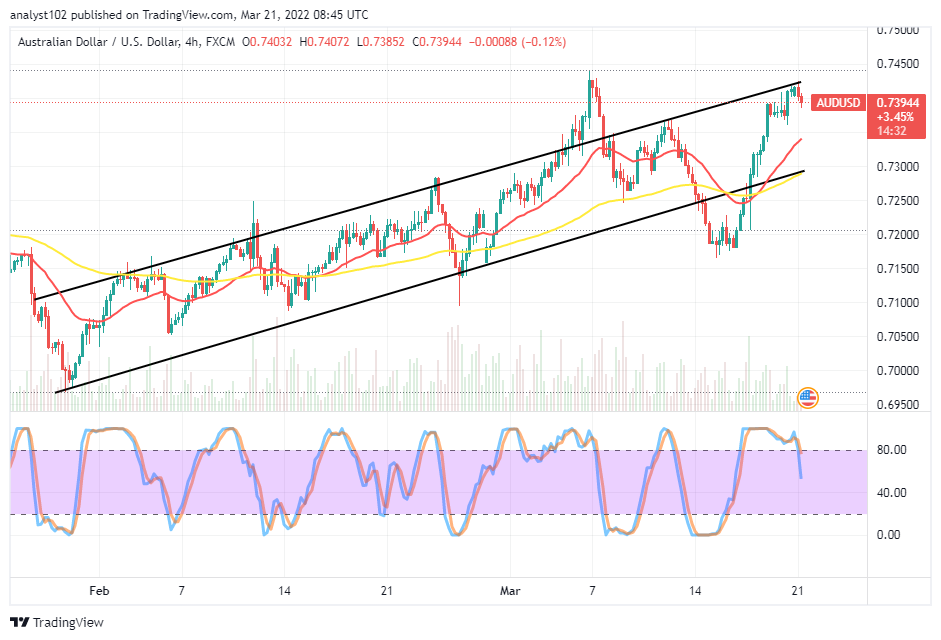
The AUD/USD 4-hour chart showcases the currency pair market swings high to hover around 0.7400. There have been off-ups and off-downs against the bullish channel trend lines drawn to ascertain the path the upward swings keep presently. The 14-day SMA indicator has crossed the 50-day SMA indicator to the north side. And they are currently beneath the current market price. The Stochastic Oscillators have crossed southbound from the overbought region, indicating a downward force is prevailing on a gradual mode.
Note:Forexschoolonline.com is not a financial advisor. Do your research before investing your funds in any financial asset or presented product or event. We are not responsible for your investing results.
Learn to Trade Forex Online
AUD/USD Market Swings High to Hover at 0.7400
Footer

ForexSchoolOnline.com helps individual traders learn how to trade the Forex market
WARNING: The content on this site should not be considered investment advice and we are not authorised to provide investment advice. Nothing on this website is an endorsement or recommendation of a particular trading strategy or investment decision. The information on this website is general in nature so you must consider the information in light of your objectives, financial situation and needs.
Investing is speculative. When investing your capital is at risk. This site is not intended for use in jurisdictions in which the trading or investments described are prohibited and should only be used by such persons and in such ways as are legally permitted. Your investment may not qualify for investor protection in your country or state of residence, so please conduct your own due diligence or obtain advice where necessary. This website is free for you to use but we may receive a commission from the companies we feature on this site.
We Introduce people to the world of currency trading. and provide educational content to help them learn how to become profitable traders. we're also a community of traders that support each other on our daily trading journey
Forexschoolonline.com is not a financial advisor. Do your research before investing your funds in any financial asset or presented product or event. We are not responsible for your investing results.

Leave a Reply