AUD/USD Price Prediction – March 7
Different trading activities have been happening that have now led to hiking in the AUD/USD market operations as the currency pair price breaks past variant resistances over some days’ sessions. Given the financial trading status of the fiat currency pair, the opening price balance as of today is 0.7371 as the high, and the low values are 0.7441 and 0.7354 to maintain a minute positive percentage of 0.70.
AUD/USD Market
Key Levels:
Resistance levels: 0.7500, 0.7600, 0.7700
Support levels: 0.7300, 0.7200, 0.7100
AUD/USD – Daily Chart
The AUD/USD daily chart shows the currency pair price breaks past variant resistances as it keeps stronger, consolidating northward in an overbought condition until the writing of these analytics. The upper bullish channel trend line drawn has been breached, featuring a bullish candlestick to denote the intense pace of the trading situation. The 14-day SMA indicator moves up underneath toward the 50-day SMA indicator. And they are below the current trading level. The Stochastic Oscillators are in the overbought region, moving in a consolidation style to denote the base currency is on a higher-increasing mode presently.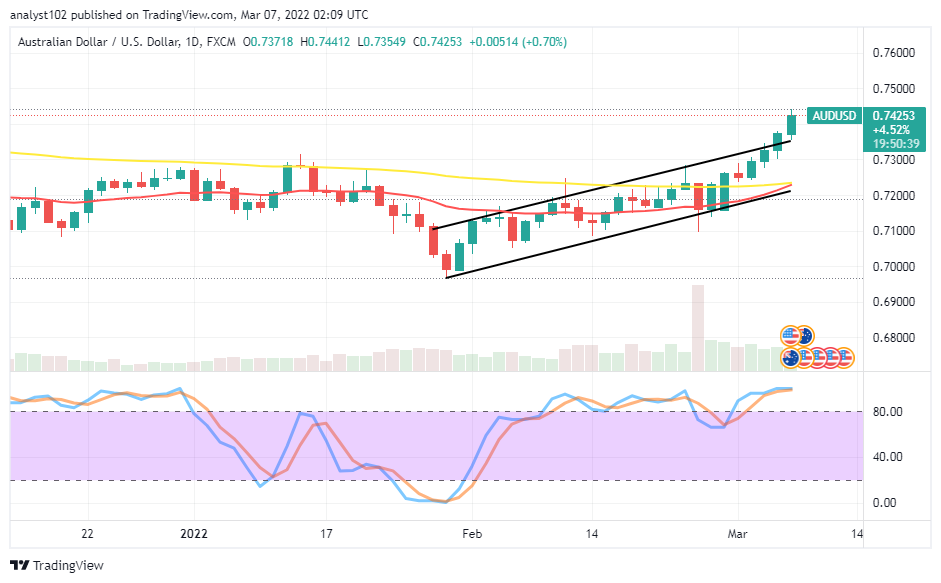 Is there any sign suggesting an end to the current bullish trend as the AUD/USD price breaks past variant resistances?
Neither a sign suggesting a stop to the current bullish trend nor a decent entry to join the moves to the upside has resurfaced. A visible pull-down is necessary to occur in a correctional form to give strength back to the northward trend so that bulls may rebuild a better entry. Traders should be wary of a sudden bearish candlestick, especially if its emergence engulfs the immediate past set of bullish candlesticks.
On the downside of the technical analysis, the AUD/USD market short-position placers may have to wait for about two or three bearish candlesticks at a higher trading zone to begin considering the launching of shorting orders. Bears may get it right if the price loses momentum around 0.7500 resistance level.
At a glance, long-position takers needed to be wary of launching further buying orders, especially when no force is backing the entries. Short-position takers may have to be on the lookout for bulls’ weakness when a confluence of variant candlesticks formed around a higher resistant trading spot to launch a sell order afterward by taking to the rules of not using high lot size or over-leverage.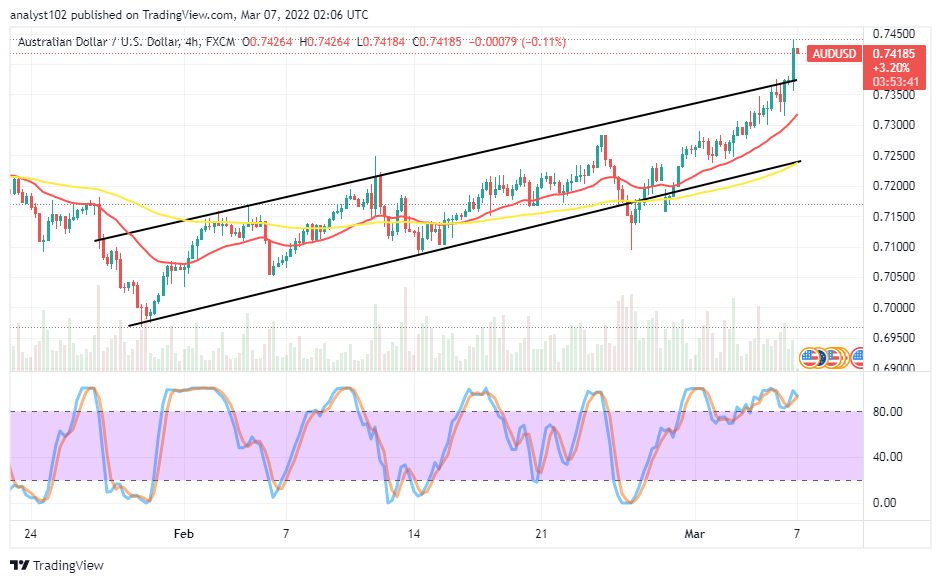 AUD/USD 4-hour Chart
The AUD/USD 4-hour chart reveals the currency-pair price breaks past variant resistances as bullish candlestick formed above the upper bullish channel trend line portends an extreme overbought trading condition for the current trading outlook. The 14-day SMA indicator is above the 50-day SMA indicator. And, they are pointing toward the north side underneath the present trading level. The Stochastic Oscillators are in the overbought region, moving in a consolidation manner to denote that bullish momentum is in an increasing-moving mode. But, it seems that the price will soon encounter resistance beneath 0.7450.
Note:Forexschoolonline.com is not a financial advisor. Do your research before investing your funds in any financial asset or presented product or event. We are not responsible for your investing results.
Learn to Trade Forex Online
AUD/USD Price Breaks Past Variant Resistances
Footer

ForexSchoolOnline.com helps individual traders learn how to trade the Forex market
WARNING: The content on this site should not be considered investment advice and we are not authorised to provide investment advice. Nothing on this website is an endorsement or recommendation of a particular trading strategy or investment decision. The information on this website is general in nature so you must consider the information in light of your objectives, financial situation and needs.
Investing is speculative. When investing your capital is at risk. This site is not intended for use in jurisdictions in which the trading or investments described are prohibited and should only be used by such persons and in such ways as are legally permitted. Your investment may not qualify for investor protection in your country or state of residence, so please conduct your own due diligence or obtain advice where necessary. This website is free for you to use but we may receive a commission from the companies we feature on this site.
We Introduce people to the world of currency trading. and provide educational content to help them learn how to become profitable traders. we're also a community of traders that support each other on our daily trading journey
Forexschoolonline.com is not a financial advisor. Do your research before investing your funds in any financial asset or presented product or event. We are not responsible for your investing results.
Leave a Reply