USD/CAD Long-Term Analysis: Ranging
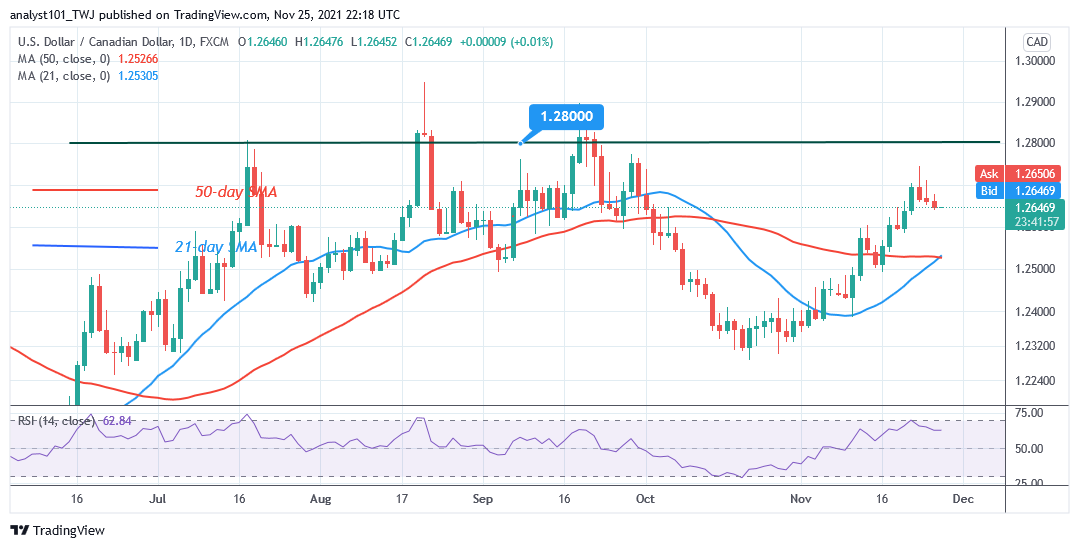
USD/CAD pair is in a sideways move below the overhead resistance at level 1.2800. On November 22 uptrend; the currency pair reached the high of level 1.2705. The current uptrend has been terminated as the market reached the overbought region. However, after a minor retracement, the upward move has resumed retesting the 1.2800 overhead resistance. Nonetheless, the overhead resistance at level 1.2800 has not been broken since July.
USD/CAD Indicator Analysis
The currency pair is at level 65 of the Relative Strength Index for period 14. The pair is in the uptrend trend zone and has room to rally on the upside. The price bars are above the 21-day SMA and the 50-day SMA indicating a possible upward move. USD/CAD is above the 25% range of the daily stochastic. The market has resumed bullish momentum.

Technical indicators:
Major Resistance Levels – 1.3300, 1.3400, 1.3500
Major Support Levels – 1.2300, 1.2200, 1.2100
What Is the Next Direction for USD/CAD?
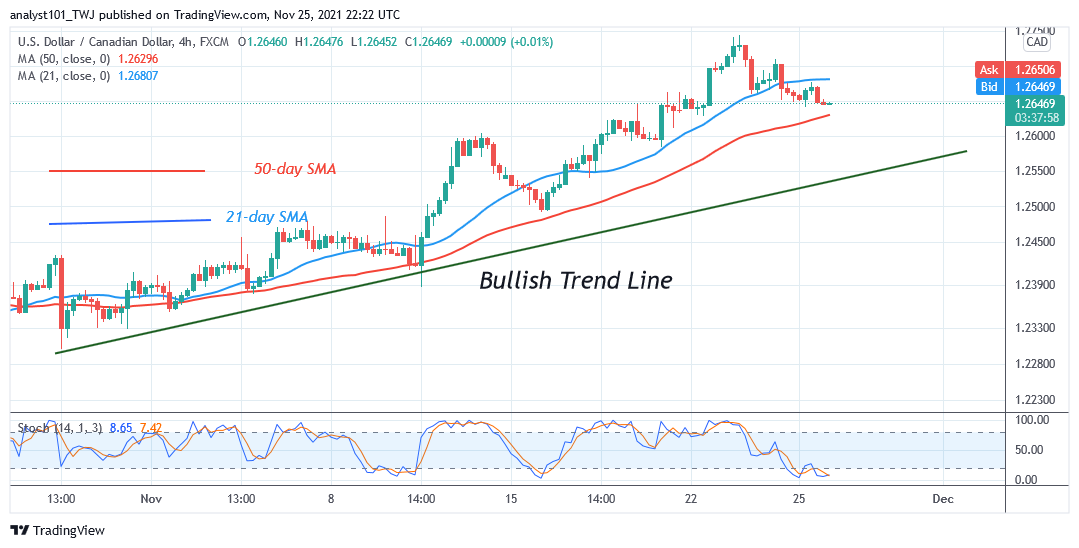
On the 4 Hour Chart, the pair is in an upward move. The currency price is above the 50-day line but below the 21-day line moving averages. The pair has rebounded above the 50-day line moving average. It is struggling to break above the 21-day line moving averages. USD/CAD uptrend will receive an accelerated movement when price breaks above the moving averages.

Note: Forexschoolonline.com is not a financial advisor. Do your research before investing your funds in any financial asset or presented product or event. We are not responsible for your investing results


Leave a Reply