EUR/JPY Long-Term Analysis: Ranging
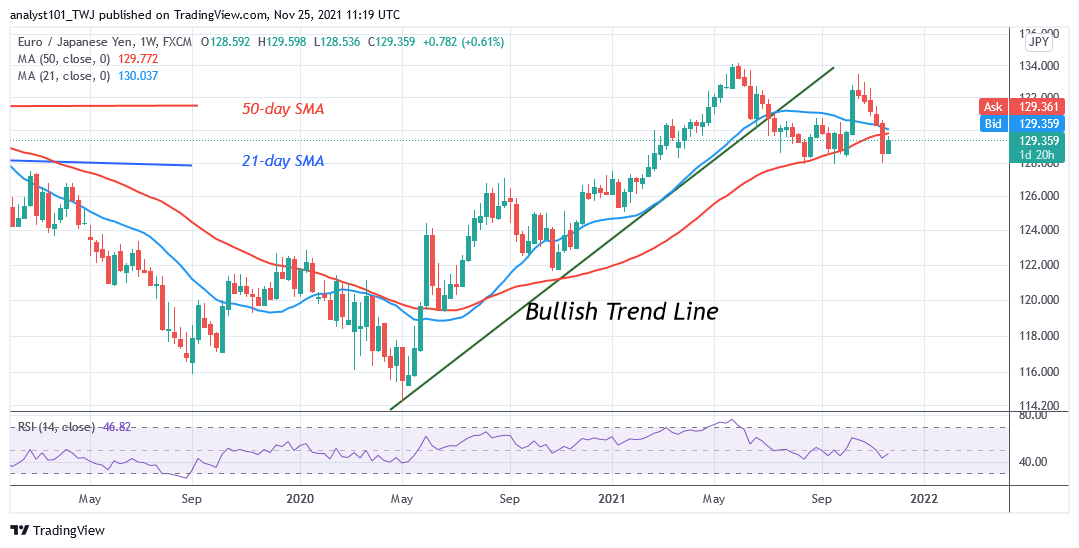
EUR/JPY pair has resumed a sideways trend after price got stuck at level 134.00. On May 24, the first uptrend reached the high of level 134.00 but was resisted. Later the currency pair resumed a sideways move as bulls failed to break above the overhead resistance. Presently, the market is fluctuating between levels 128.00 and 134.00. If buyers break above level 134.00, it will signal the resumption of the uptrend. The currency has fallen to the support above the lower price range. Today, buyers are resuming the sideways trend as price rises upward. The range-bound move will continue as long as the range-bound levels remain unbroken.
EUR/JPY Indicator Analysis
The currency price is below the moving averages. The sideways trend will resume when price breaks above the moving averages. The currency pair is at level 46 of the Relative Strength Index for period 14. The pair is in the downtrend zone and below the centerline 50. In the lower time frame, the 21-day SMA and the 50-day SMA are sloping downward. EUR/JPY is above the 60% range of the daily stochastic.

Technical indicators:
Major Resistance Levels – 133.00, 134.000, 135.000
Major Support Levels – 128.000, 127.000, 126.000
What Is the Next Direction for EUR/JPY?
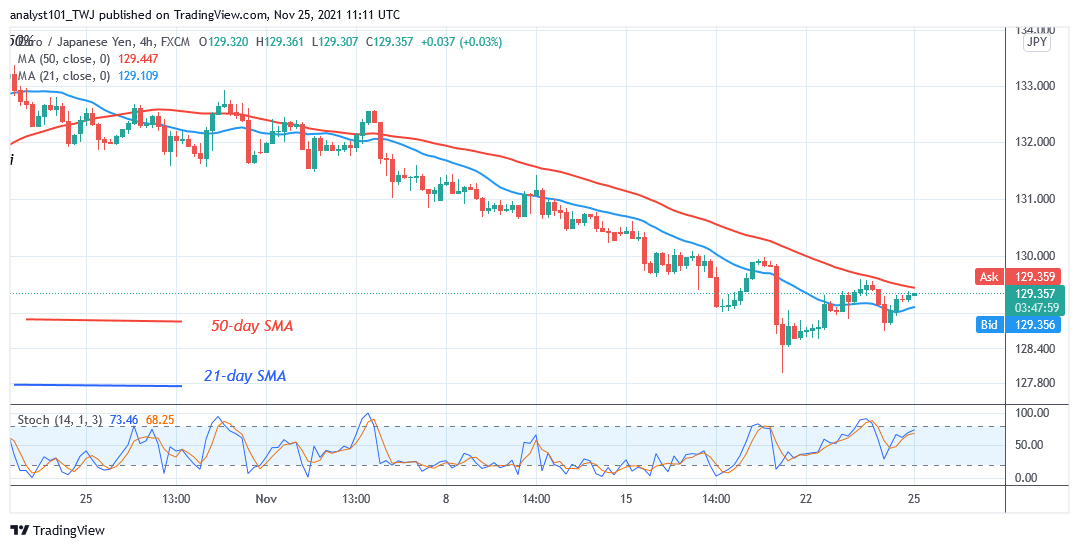
On the 4-hour chart, the pair is in a downward move. EUR/JPY has risen and broken above the 21-day line moving averages. It is facing rejection at the 50-day line moving average. This may lead to a further downward movement of the pair. In the downtrend, the 21-day line and the 50-day line moving averages are acting as resistance levels.

Note: Forexschoolonline.com is not a financial advisor. Do your research before investing your funds in any financial asset or presented product or event. We are not responsible for your investing results


Leave a Reply