British Pound Price Prediction – September 21
It recorded that the GBP/USD trade downsizes, hovering at 0.36000 support level. The fiat currency pair trades around 0.3662 line estimated at a percentage rate of 0.08. The expectation is on the rise that the market may soon see an upswing in its valuation.
GBP/USD Market
Key Levels:
Resistance levels: 1.3800, 1.3900, 1.4000
Support levels: 1.3600, 1.3500, 1.3400
GBP/USD – Daily Chart
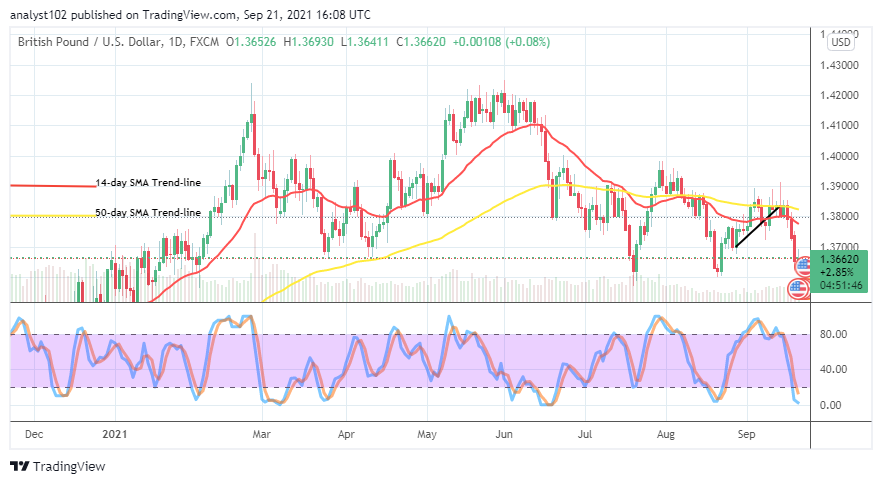
The GBP/USD daily chart showcases that the currency pair trade downsizes, hovering at the 0.3600 support level as the market is yet to determine the next direction. The 50-day SMA indicator is above the 14-day SMA indicator as the bullish trend line drew to touch a high value-line around the trend line of the bigger SMA. The Stochastic Oscillators are dipped into the oversold region, closely moving to touch the range zero. That is an indication that the market may soon relax around a lower trading axis. Will there be another round of price upswings around the 0.3600 as the trade downsizes, approaching it?
There can be another round of price upswings around the level of 0.3600 as the trade downsizes, hovering around it. In the next few days, the market may tend to finalize its stand by looking for a way to find a supportive sit around the point. Meanwhile, in the process of trying to accomplish that, some degrees of cautiousness needed to exercise.
On the downside, the GBP/USD market bears should be warier of exerting sell positions around the support level at 0.3600. A sudden pushing to the point will probably cause a whipsaw-trading situation for the currency pair market. As a result, the motion to the south side will most likely pave some degrees of chance that may return to the north side.
Summarily, as of this point, traders may have to get prepared to launch a long position in the near time. However, price may still go about consolidating around the lower support line at 0.3600 for a while. GBP/USD 4-hour Chart
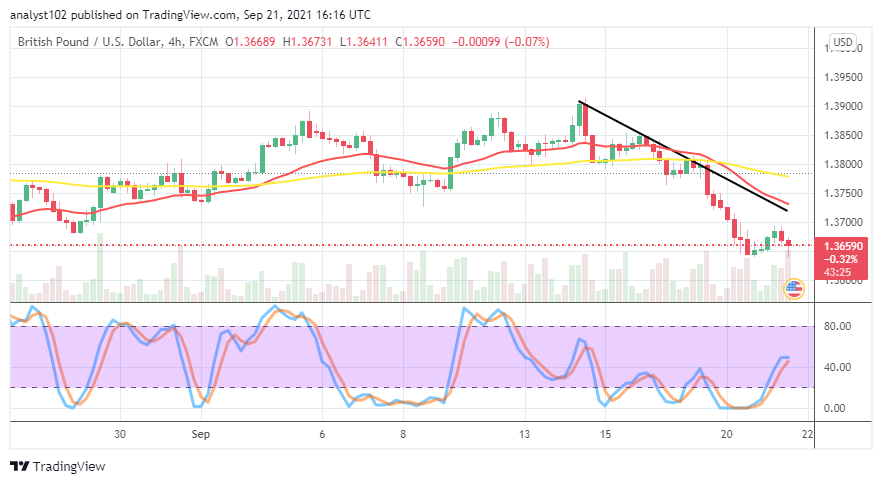
The GBP/USD 4-hour chart exhibits that the trade downsizes, hovering at 0.3600 support level. The 14-day SMA trend line is below the 50-day SMA trend line. The Stochastic Oscillators have crossed the lines a bit over the range of 40. It indicated that some selling pressures are relative to play out.
Note: Forexschoolonline.com is not a financial advisor. Do your research before investing your funds in any financial asset or presented product or event. We are not responsible for your investing results.
Learn to Trade Forex Online
GBP/USD Trade Downsizes, Hovering at 0.3600 Support
Footer

ForexSchoolOnline.com helps individual traders learn how to trade the Forex market
WARNING: The content on this site should not be considered investment advice and we are not authorised to provide investment advice. Nothing on this website is an endorsement or recommendation of a particular trading strategy or investment decision. The information on this website is general in nature so you must consider the information in light of your objectives, financial situation and needs.
Investing is speculative. When investing your capital is at risk. This site is not intended for use in jurisdictions in which the trading or investments described are prohibited and should only be used by such persons and in such ways as are legally permitted. Your investment may not qualify for investor protection in your country or state of residence, so please conduct your own due diligence or obtain advice where necessary. This website is free for you to use but we may receive a commission from the companies we feature on this site.
We Introduce people to the world of currency trading. and provide educational content to help them learn how to become profitable traders. we're also a community of traders that support each other on our daily trading journey
Forexschoolonline.com is not a financial advisor. Do your research before investing your funds in any financial asset or presented product or event. We are not responsible for your investing results.

Leave a Reply