AUD/USD Prediction – August 23
The AUD/USD market dumps heavily within the bearish channel trend lines as the currency pair’s percentage rate is at -0.09. That shows that the downward moving pace that the market keeps of writing tends to start, keeping a slow motion. The market valuation trades around 0.7138 line.
AUD/USD Market
Key Levels:
Resistance levels: 0.7200, 0.7300, 0.7400
Support levels: 0.7000, 0.6900, 0.6800
AUD/USD – Daily Chart
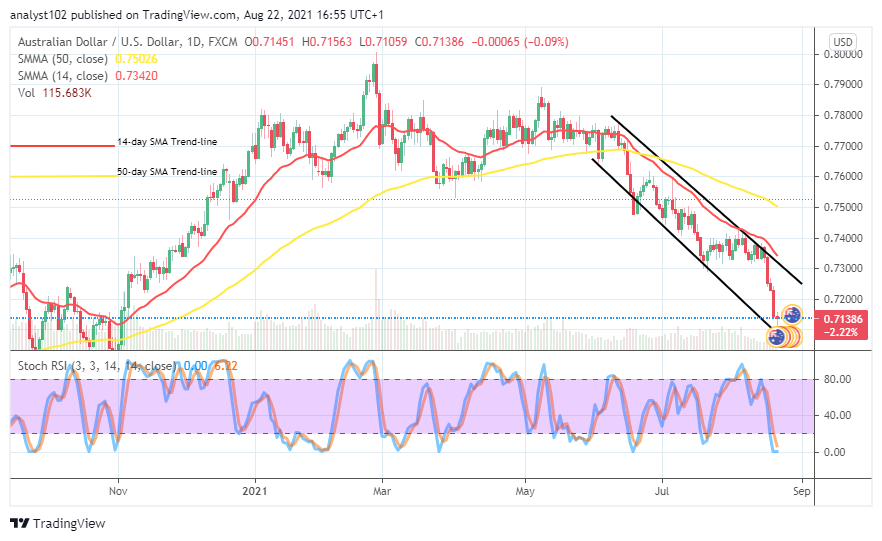
The AUD/USD daily chart reveals that the currency-pair market dumps heavily within the well-defined bearish channel trend lines drawn. On August 17th day’s session, a bearish candlestick occurred against the level at 0.7300, spanning the force further southward to break down 0.7200 line that witnessed a bullish candlestick around the last year’s November sessions. The 14-day SMA trend-line is drawn alongside the upper bearish channel trend-line as the 50-day SMA trend-line is above them. The Stochastic Oscillators have touched down a critical lowest range in the oversold region. That suggests that the downward force may soon witness a line of rallying motions in the near time. Will the AUD/USD trade go down below lower support lines as the currency-pair market dumps heavily?
There is a tendency that the AUD/USD’s price will go down more beyond some of the subsequent lower support lines. The force that the market succumbs to makes it difficult for bulls to get a better deal at finding a decent buying entry ever since the bearish channel trend lines have come to stay, showcasing the path that the market keeps to the downside. However, the readings of Stochastic Oscillators now signal that some ups may soon feature, possibly around the line of 0.7100.
On the downside, it may be necessary that traders willing to go short further on this currency-pair market to allow price makes a pull-up to test around a resistance around 0.7200 before considering re-launching of sell positions. A fearful breakout at that level may put the trading operation on the track to lay a bedrock that some upswings will find support.
Summarily, as the AUD/USD now witnesses a heavy dump in its valuation, and the readings of the Stochastic Oscillators suggest that bears should be wary of going further southward at this time. It shows that a critical lowest range line has hit that it necessary that price makes a line of rallying motions. AUD/USD 4-hour Chart
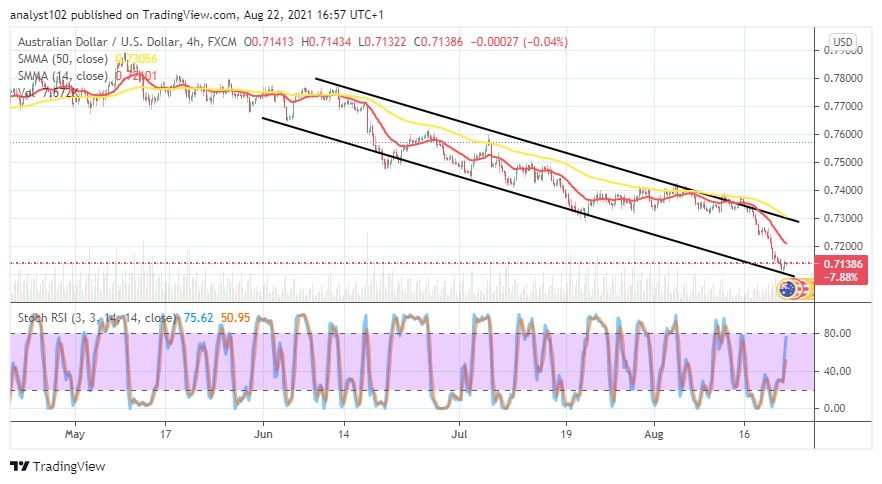
The AUD/USD 4-hour chart equally records that the currency-pair market dumps heavily in the well-defined bearish channel trend lines drawn. The 14-day SMA trend-line is beneath the 50-day SMA trend-line. A line of smaller bullish candlesticks has formed, signaling the possibility of seeing the currency-pair trade returning in a visible rallying movement. The Stochastic Oscillators have slightly swerved northbound close to the range of 80. That attests to the potentiality of seeing the presumed ups soon.
Note: Forexschoolonline.com is not a financial advisor. Do your research before investing your funds in any financial asset or presented product or event. We are not responsible for your investing results.
Learn to Trade Forex Online
AUD/USD Market Dumps Heavily
Footer

ForexSchoolOnline.com helps individual traders learn how to trade the Forex market
WARNING: The content on this site should not be considered investment advice and we are not authorised to provide investment advice. Nothing on this website is an endorsement or recommendation of a particular trading strategy or investment decision. The information on this website is general in nature so you must consider the information in light of your objectives, financial situation and needs.
Investing is speculative. When investing your capital is at risk. This site is not intended for use in jurisdictions in which the trading or investments described are prohibited and should only be used by such persons and in such ways as are legally permitted. Your investment may not qualify for investor protection in your country or state of residence, so please conduct your own due diligence or obtain advice where necessary. This website is free for you to use but we may receive a commission from the companies we feature on this site.
We Introduce people to the world of currency trading. and provide educational content to help them learn how to become profitable traders. we're also a community of traders that support each other on our daily trading journey
Forexschoolonline.com is not a financial advisor. Do your research before investing your funds in any financial asset or presented product or event. We are not responsible for your investing results.

Leave a Reply