AUD/USD Prediction – August 9
The AUD/USD trade operation dumps after hitting resistance around the level of 0.7400. The currency pair market records a percentage rate of about -0.26 to trade around the line at 0.7333.
AUD/USD Market
Key Levels:
Resistance levels: 0.7400, 0.7500, 0.7600
Support levels: 0.7200, 0.7100, 0.7000
AUD/USD – Daily Chart
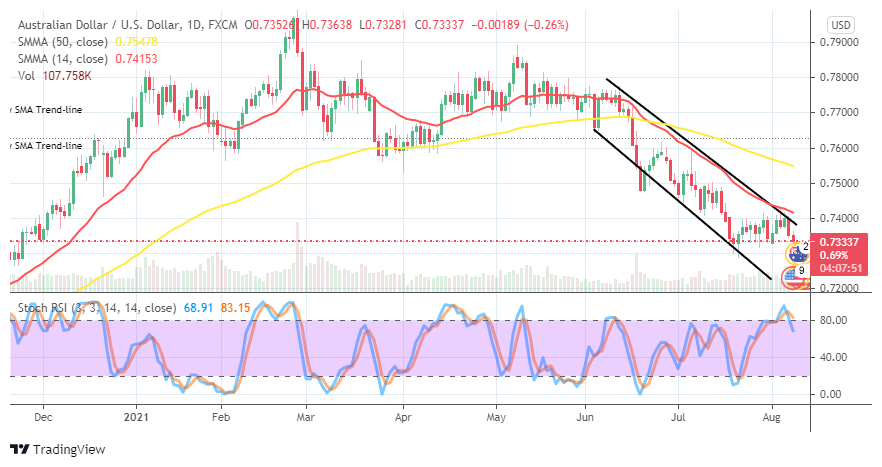
The AUD/USD daily chart shows that the currency pair trade operation dumps at 0.7400 due to the inability of the price to surge past the resistance line mentioned earlier. The dumping movement began during the August 6th trading session. And, the downward force is in a gradual moving manner, getting heightened. The bearish channel trend lines are yet intently drawn to guide along the southward path that the currency pair may be keeping. The 50-day SMA is over the 14-day SMA that trends alongside the upper bearish channel trend-line. The Stochastic Oscillators have crossed the lines southbound slightly against the range at 80. That suggests that a downward force is taking control of the currency pair market. Will the AUD/USD currency pair keep on further with the trade operation dumps?
It is most likely that the AUD/USD currency pair keeps pushing southward further with the trade operation dumps. However, the market may find breaking past support at 0.7300 difficult. That can later cause a pause coupled with a line of range price movements. If at that point, a bearish candlestick suddenly resurfaces against it, then bulls will have to be on the lookout for settling support around the immediate support line.
On the downside, the AUD/USD bears now have to hold their presence in the market firmly under the resistance line of 0.7400. They needed to capitalize on the slight downward force to push through some supports in the bearish channel trend lines. The reading of the Stochastic Oscillators suggests that the market likely downturn economically in the near time.
Summarily, it still appears that the AUD/USD market is dominated by downward pressures. Therefore fore, traders are to look out for decent sell entries against buying positions for the time being. AUD/USD 4-hour Chart
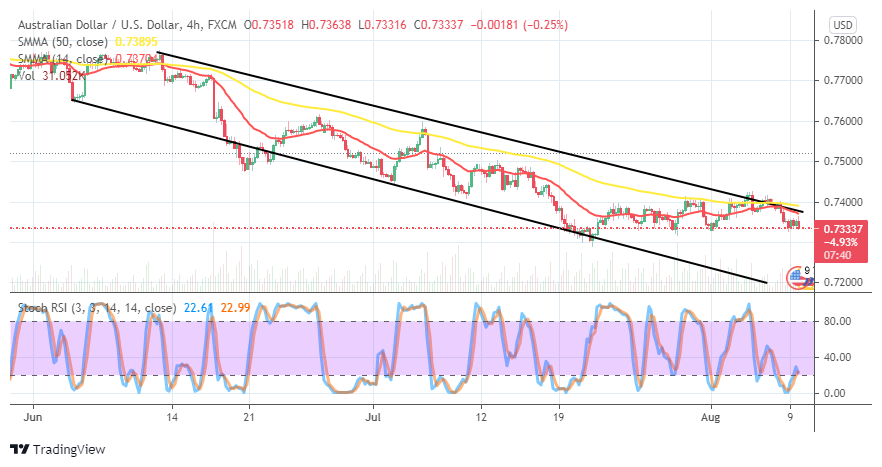
It more distinctively featured on the AUD/USD medium-term chart that the currency pair trade operation dumps in definite bearish channel trend lines. The 50-day SMA indicator is a bit above the 14-day SMA indicator as to the upper bearish channel trend-line tight at the tail end of the smaller SMA. The Stochastic Oscillators have moved up from the oversold region. But, they have now closed the lines at range 20 in an attempt to point southbound. That indicates that the price may most likely decline further in the near session.
Note: Forexschoolonline.com is not a financial advisor. Do your research before investing your funds in any financial asset or presented product or event. We are not responsible for your investing results.
Learn to Trade Forex Online
AUD/USD Trade Operation Dumps at 0.7400
Footer

ForexSchoolOnline.com helps individual traders learn how to trade the Forex market
WARNING: The content on this site should not be considered investment advice and we are not authorised to provide investment advice. Nothing on this website is an endorsement or recommendation of a particular trading strategy or investment decision. The information on this website is general in nature so you must consider the information in light of your objectives, financial situation and needs.
Investing is speculative. When investing your capital is at risk. This site is not intended for use in jurisdictions in which the trading or investments described are prohibited and should only be used by such persons and in such ways as are legally permitted. Your investment may not qualify for investor protection in your country or state of residence, so please conduct your own due diligence or obtain advice where necessary. This website is free for you to use but we may receive a commission from the companies we feature on this site.
We Introduce people to the world of currency trading. and provide educational content to help them learn how to become profitable traders. we're also a community of traders that support each other on our daily trading journey
Forexschoolonline.com is not a financial advisor. Do your research before investing your funds in any financial asset or presented product or event. We are not responsible for your investing results.

Leave a Reply