Market Analysis – EURCHF Has Posed a Bullish Flag Continuation Pattern
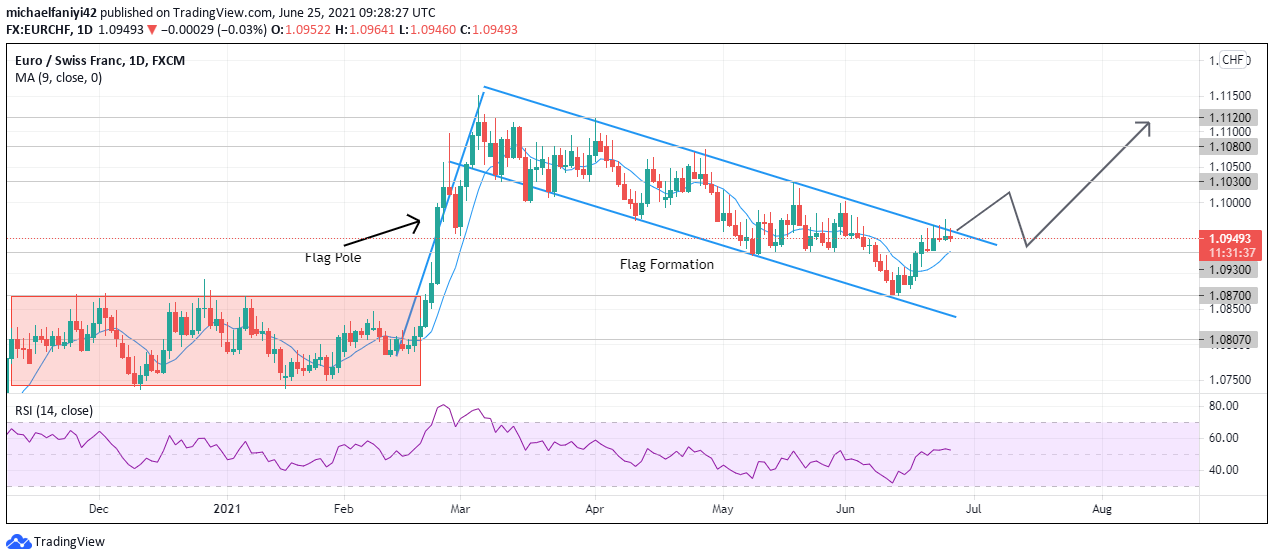
The EURCHF bullish flag pattern has been formed to resume the market’s upward momentum. EURCHF’s bullish movement began on the 19th of February 2021 when the price broke out of consolidation. The market skyrocketed after breaking the 1.08700 barrier.
The upward impulse was so strong that the market posted strong bullish candles for four consecutive days. There were two days of retracement before the price followed by another four days of consecutive bullish candles to eventually reach the 1.1150 key level, which is the year’s high.
Thereafter, the market began to go downwards through a descending channel. This can be seen in the way the price zigzags between the channel’s upper and lower borders, making consecutive lower lows and lower highs. The market has therefore conformed to a flag pattern, which is a bullish continuation pattern. The 9MA’s (Moving Average) undulating movement shows the zigzagging pattern of EURCHF through the descending channel. Its signal line is currently under the daily candles, showing a current upward movement. The RSI (Relative Strength Index) indicator is at 52.78, also showing the current bullish movement of the market. The daily candles have now touched the upper border of the descending channel.
EURCHF Key Levels
Resistance Levels: 1.11200, 1.10800, 1.10300
Support Levels: 1.09300, 1.08700, 1,08070
What to Expect After the EURCHF Bullish Flag Pattern Formation
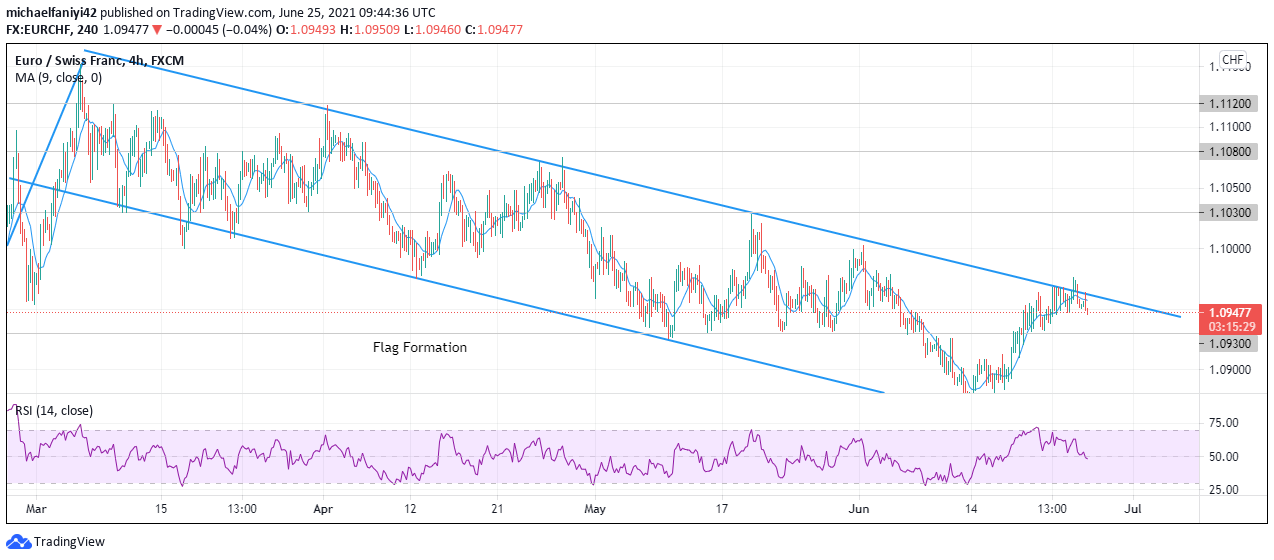
The price has hit the upper border of the descending channel multiple times and even had a false breakout, but the upper border has successfully defended the market. EURCHF is currently showing bearish candles on the 4-hour chart. This means that buyers have weakened and the price is once again falling. The RSI indicator is at 47.84 and is bending downwards. This indicates that the market was rejected at the upper border. The 9MA has also begun to move above the 4-hour candles, which is a bearish sign for the market. From the look of things, the EURCHF is set to fall again to the lower border of the descending channel for another rally, but the bulls could yet revive at the 1.09300 support and finally push for the upwards breakout.
Note: Forexschoolonline.com is not a financial advisor. Do your research before investing your funds in any financial asset or presented product or event. We are not responsible for your investing results.


Leave a Reply