Market Analysis – EURUSD Slumps
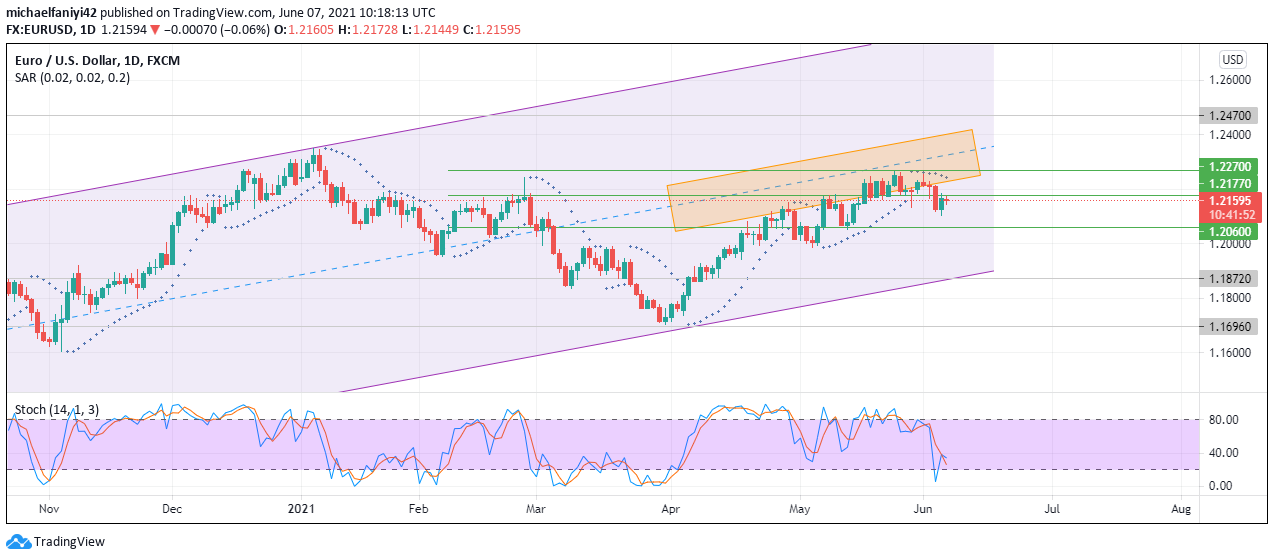
EURUSD slumps after hitting the midline of its ascending parallel channel. The market has been trailing an ascending parallel channel since the 23rd of March 2020 and its midline has been very influential in directing the market. It has alternatively been acting as support and resistance. The market’s key levels also remain authoritative along the journey. Price has hit a confluence zone consisting of the channel midline and the key levels 1.22700, 1.21770, and 1.20600. EURUSD started a cycle by touching the upper border of the channel on the 6th of January 2021. The market then slumped to the lower border of the channel at 1.6960 support on the 31st of March 2021. The price rallied and began a gentle ascent. The upwards movement was steady till the market hit the confluence zone.
The price broke through 1.20600 but rebound against 1.21770 to fall back below 1.20600. EURUSD broke out again and after a bit of struggle with 1.21770, it went through. On getting to 1.22700, market bulls had become weak and after two interactions, the price slumped below 1.21770.
EURUSD Key Levels
Resistance Zones: 1.24700. 1.22700, 1.21770
Support Zones: 1.20600, 1.18720, 1.16960
What Next After EURUSD Slump?
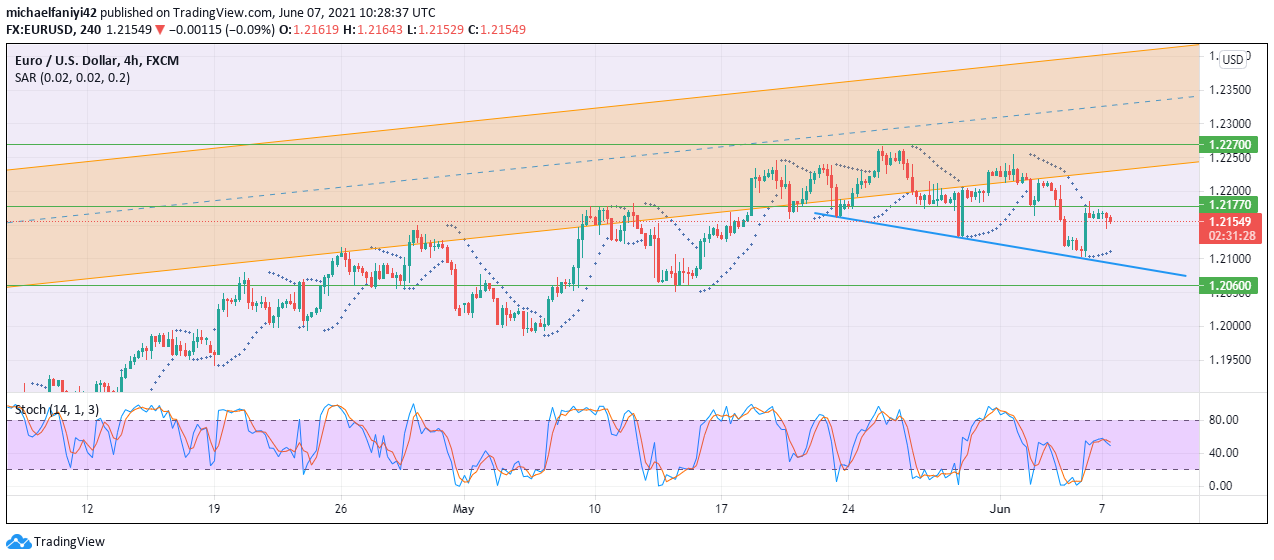
On the daily chart, the market is currently displaying a Doji candle. This signifies that there is market indecision. However, the Parabolic SAR (Stop and Reverse) shows that sellers are still very active, as it currently has 7 dots above the market, showing strong bearish activities. The Stochastic Oscillator is showing a very interesting pattern. The blue signal got to the oversold region and rebounded sharply upwards. It then got to 38.35 and instantly turn downwards again and the red signal line (which is always coming down) crossing it at that point. On the 4-hours chart, consecutive lower lows can be seen. EURUSD is currently on a retracement at 1.21770 resistance with small candlesticks lined up. The parabolic SAR has its dots under the candles to show the retracement. The Stochastic signal lines show a selling activity after crossing each other at 58.02 and changing direction downwards.
Note: Forexschoolonline.com is not a financial advisor. Do your research before investing your funds in any financial asset or presented product or event. We are not responsible for your investing results.


Leave a Reply