British Pound Price Prediction – May 25
The trade valuation of British Pound has managed to strive more northwardly against the market worth of the US Dollar. The base currency price now hovers closely below the level of 1.4200 at an about 0.08% increase.
GBP/USD Market
Key Levels:
Resistance levels: 1.4300, 1.4400, 1.4500
Support levels: 1.3900, 1.3800, 1.3600
GBP/USD – Daily Chart
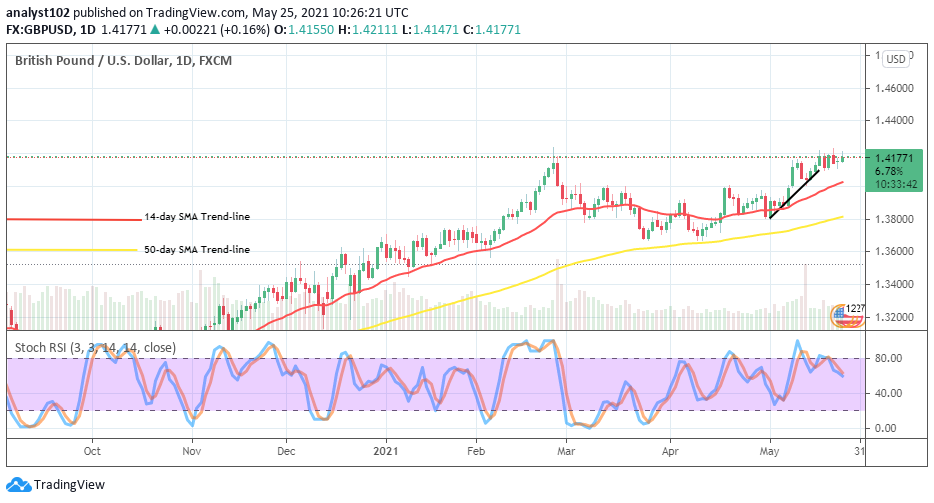
It is now depicted on the GBP/USD daily chart that the currency pair market has again reached a high difficult resistance level as seen around February 24th day’s trading session. Meanwhile, the current GBP/USD situation of trading seems to be a bit different by featuring a line of higher lows around the value of 1.4200. The 14-day SMA trend-line is located over the 50-day SMA indicator as they both point towards the north direction. The Stochastic Oscillators have briefly crossed the hairs to the southbound toward range 40. That suggests that a downward move is in the offing. GBP/USD market upswing, will it swing past the 1.4200 level?
A sudden bullish candlestick devoid of reversal outlook needs to emerge against the key 1.4200 resistance point so as to allow more upsides in the GBP/USD trade operations. A downward move in a bid of finding support around the smaller SMA may technically bring about a correction in the currency market. Therefore, buyers should be wary of their entry during the period that that assumed scenario could play out afterward.
The present market level of 1.4200 has to hold strong by GBP/USD sellers. But, currently, there is a less-active price action ongoing in the currency trade. As a result, traders are enjoined to be on the lookout for when there will be presence of volatility to be able to get a reliable direction. The higher resistance level of 1.4400 could be a better of the presi
in summary, as the GBP/USD price now hovers nearing the high point of 1.4200, traders should take the cognizance of the point by being on the lookout for a volatile move to occur to be able to know the clearer picture of market’s next definite direction. GBP/USD 4-hour Chart
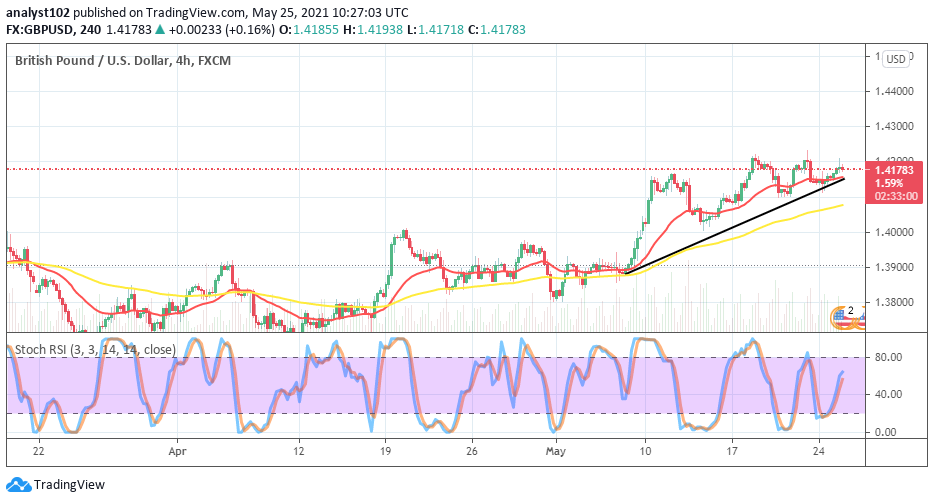
The GBP/USD 4-hour chart depicts that between May 18 and 21, the market level of 1.4200 had been touched and resisted. Today’s session has seemingly seen the same trading situation. The bullish trend-line drew below the 14-day SMA trend-line. And, the 50-day SMA indicator is situated below them. The Stochastic Oscillators have moved up from range 20 to close the hairs within the ranges of 40 and 80. That signifies that a fall-off is somewhat imminent.
Note: Forexschoolonline.com is not a financial advisor. Do your research before investing your funds in any financial asset or presented product or event. We are not responsible for your investing results.
Learn to Trade Forex Online
GBP/USD price fluctuates around the key 1.4200 resistance
Footer

ForexSchoolOnline.com helps individual traders learn how to trade the Forex market
WARNING: The content on this site should not be considered investment advice and we are not authorised to provide investment advice. Nothing on this website is an endorsement or recommendation of a particular trading strategy or investment decision. The information on this website is general in nature so you must consider the information in light of your objectives, financial situation and needs.
Investing is speculative. When investing your capital is at risk. This site is not intended for use in jurisdictions in which the trading or investments described are prohibited and should only be used by such persons and in such ways as are legally permitted. Your investment may not qualify for investor protection in your country or state of residence, so please conduct your own due diligence or obtain advice where necessary. This website is free for you to use but we may receive a commission from the companies we feature on this site.
We Introduce people to the world of currency trading. and provide educational content to help them learn how to become profitable traders. we're also a community of traders that support each other on our daily trading journey
Forexschoolonline.com is not a financial advisor. Do your research before investing your funds in any financial asset or presented product or event. We are not responsible for your investing results.

Leave a Reply