EURCHF Key Levels
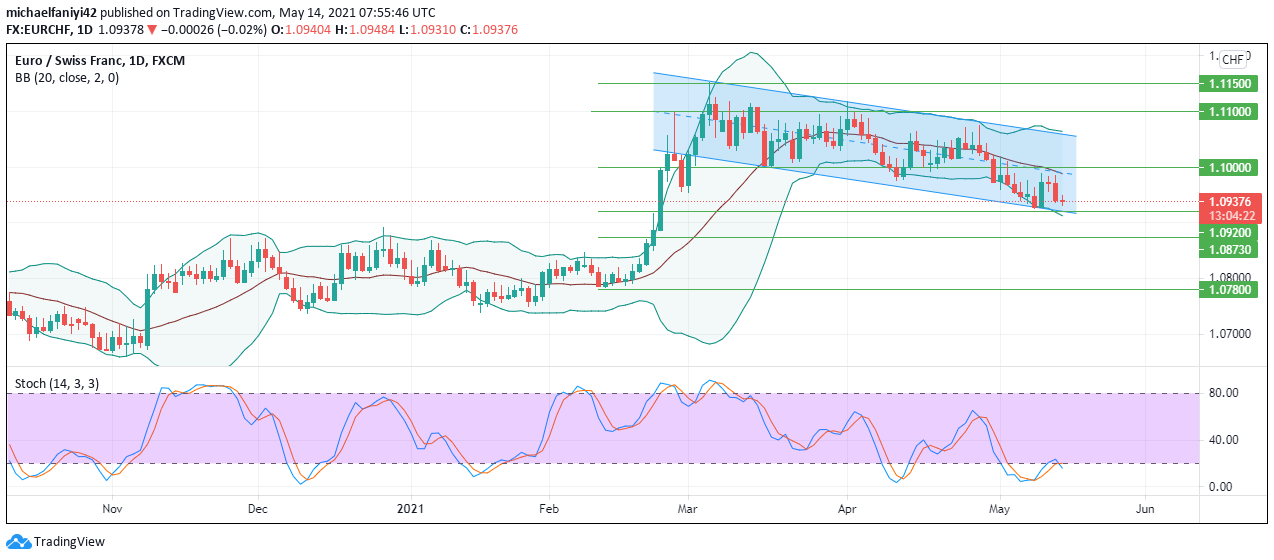
Support: 1.09200, 1.08730, 1.07800
Resistance: 1.10000, 1.11000, 11500
EURCHF has been on a gentle downtrend since a major bullish price break-out on the 23rd of February 2021. The break-out occurred after a period of prolonged market ranging, stretching far back as 9th November 2020.
On the daily chart, the EURCHF has been following the same pattern of break-out, range, and break-out again. This pattern started from the 18th of May 2020, when the first major bullish breakout occurred. Price corrected itself, ranged a little, then shot up again on the 13th of July 2020. Price is set to continue in this pattern.

EURCHF Price Anticipation
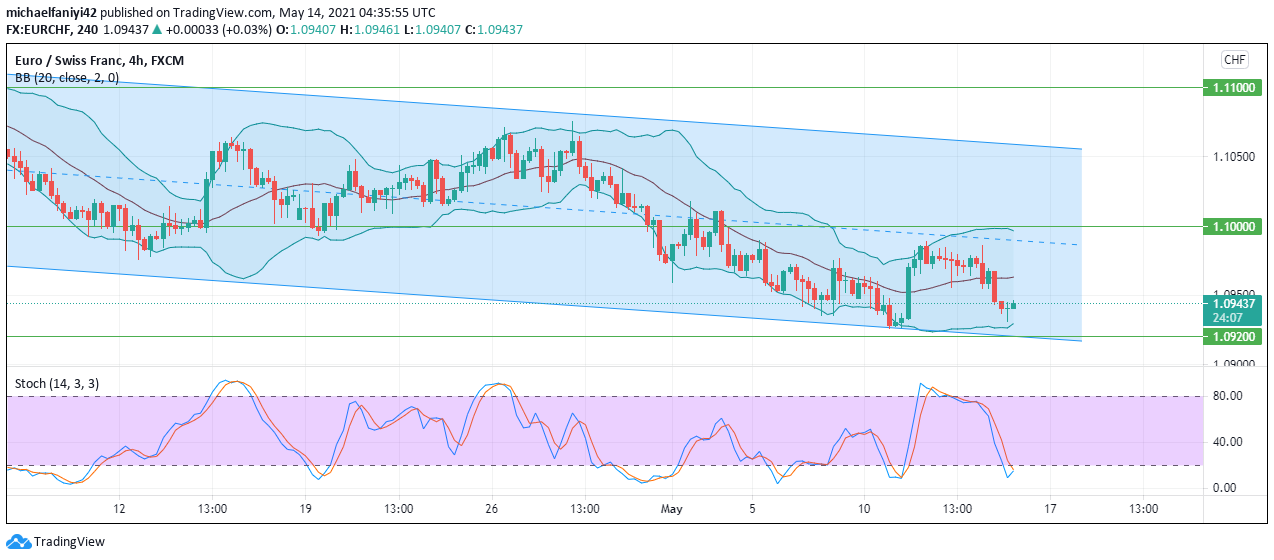
Price has been following a gently downward sloping channel to form a bullish Flag pattern. This can be seen as it makes successive lower-highs and lower-lows within the parallel channel. The 1.11000 resistance line has played a major role in keeping the price at bay. It halted the initial break-out, and though it was bypassed few times, it eventually fought to keep the price at bay. Price has since fallen beyond 1.10000 to find support at 1.09200. EURCHF is predicted to rally together and break out of the parallel channel and beyond the 1.11000 resistance, even up to 1.11500 in a repeat pattern of bullish movement. But then, the price could still plunge further to 1.08730 before the upward rally.
The Bollinger Band indicator has contracted just as in previous times. This indicates an imminent break-out. The Stochastic oscillator is currently on the 20 mark. Sellers are getting exhausted, and the buyers can take over the market any time from now. There could yet be a little more selling as price is not yet fully into the oversold region.

Price has been moving up and down along the parallel channel with the middle line acting as a resistance. The Bollinger Bands are currently below the middle line on the 4-hours chart. With a current bullish candle, and support at 1.09200 coinciding with the lower border of the channel, price is set to rally upwards beyond the middle line resistance and probably beyond the parallel channel entirely.
The Stochastic oscillator is also at the 20 mark showing an alert for imminent buying.
Note: Forexschoolonline.com is not a financial advisor. Do your research before investing your funds in any financial asset or presented product or event. We are not responsible for your investing results.


Leave a Reply