British Pound Price Prediction – May 11
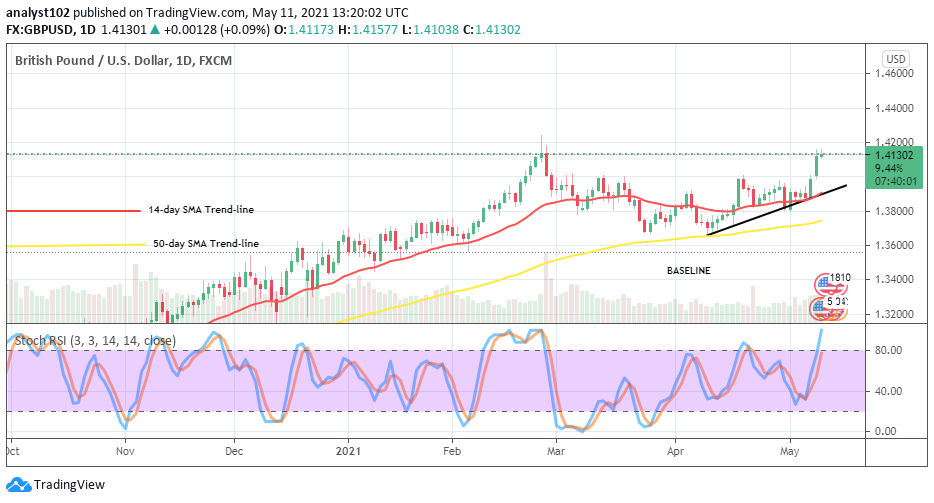
The GBP/USD trade activities have witnessed a significant increase breaking the main resistance value of 1.4000 to approach the previous higher market of 1.4200. As of writing, price is trading at about 0.07% at the level of around 1.4125.
GBP/USD Market
Key Levels:
Resistance levels: 1.4200, 1.4300, 1.4400
Support levels: 1.3900, 1.3800, 1.3700
GBP/USD – Daily Chart
The GBP/USD daily chart reveals a formation of a tiny bullish promising candlestick that could eventually shoot up further in continuation of the one already emerged during the trading session yesterday, May 10. All the SMA indicators now act as awaiting supportive trading tools underneath the present uptrend moves. The 50-day SMA is below the 14-day SMA trend-line. The Stochastic Oscillators have from a range of around 25 swerved to the north entering the overbought region. And, yet, they keep pointing towards the north direction in the region to suggest that some upside pressures are ongoing.  Will GBP/USD price break the resistances further next?
Yesterday’s sudden emergence of a breaking out candlestick has brought about a high expectation on the account that bulls will potentially intensify efforts to push harder to elongate their stance in this currency pair trade space. However, the only basic barrier point against the more ups is at the 1.4200 resistance trading zone. Therefore, bulls need to be wary of that price level.
On the contrary to the upside sentiment analysis, bears are enjoined to exercise some degrees of patience until rejection is spotted to couple with a full-formed bearish candlestick at a high level of an active trading area before considering a sell entry.
Summarily, the present trading situation portends that more longing positions are still likely to gain an upper hand in the next sessions. Therefore, traders just need to be cautious of placing entry as late entry could lead to whipsawing. GBP/USD 4-hour Chart
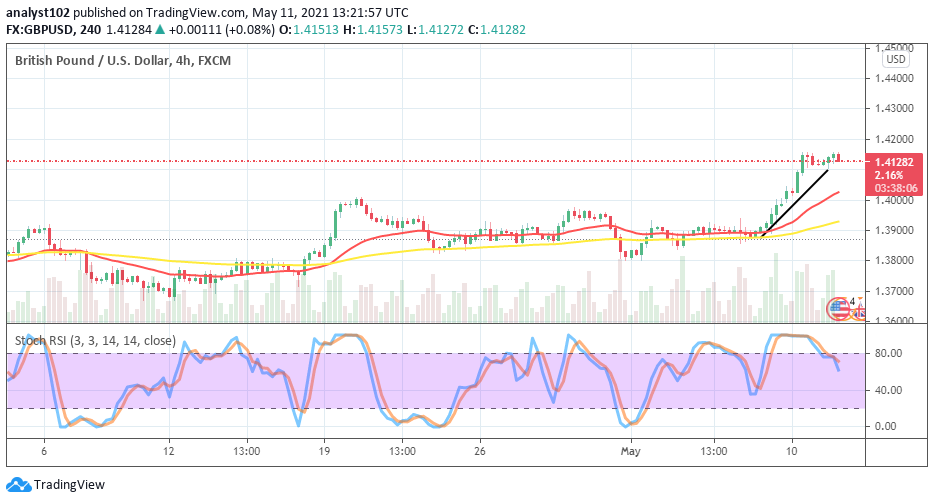
The 4-hour trading chart depicts that the GBP/USD price valuation is in an increasing moving mood. However, today’s session is witnessing variant higher lows at a bit over the level of 1.4100. The bullish trend-line is drawn to confirm the point as an immediate closer support line to the current trading zone over the SMAs. The 14-day SMA trend-line is located over the 50-day SMA. The stochastic Oscillators have briefly crossed from the overbought region to place a bit below range 80. The present trading outlook could as well result in a consolidation price movement. But, in the long run, more upsides are expected to feature afterward.
Note: Forexschoolonline.com is not a financial advisor. Do your research before investing your funds in any financial asset or presented product or event. We are not responsible for your investing results.


Leave a Reply