The spinning top candlestick pattern is an indecision candlestick pattern that shows neither the buyers or sellers are currently in control.
In a similar way to an inside bar you can use the information the spinning top provides to both find new trades and also manage any open trades.
In this post we go through exactly what the spinning top is and how you can successfully use it in your own trading.
What is the Spinning Top Candlestick Pattern?
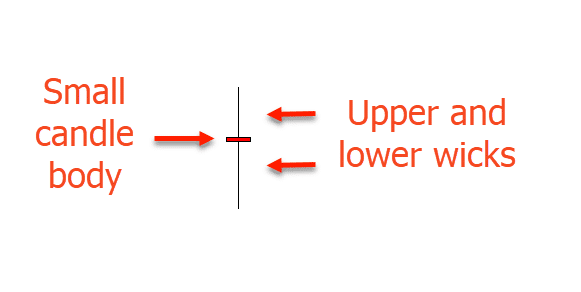
The spinning top is a pattern that has a small candlestick body and upper and lower wicks or shadows of similar lengths.
This candlestick is showing that price moved both higher and lower around the same amount during the session, but ultimately at the end it closed close to where it started.
This shows us that there is a lot of indecision. With this candlestick price tried to move higher and also tried to move lower, but in the end it could not make a move in either direction.
Why is this information important? Because when price is undecided it tells us about what may happen next. For example; if price is in a range and we see an indecision candlestick form, then we can expect to see more ranging price action. If after a strong move in one direction all of a sudden price forms an indecision candlestick, it shows price may be preparing for a reversal.

How to Identify the Spinning Top Candlestick Pattern?
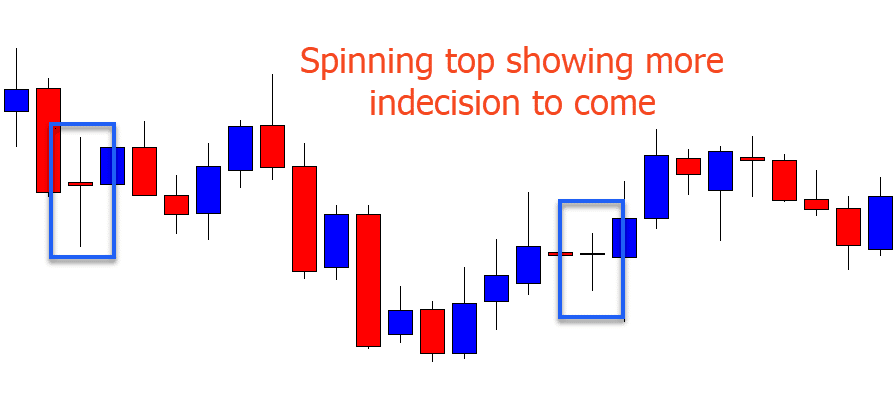
The chart example below shows two spinning top candlestick patterns in action.
The thing to note with this example is the price action that the pattern formed in. Price had been forming within a sideways range. This is very important information because where the spinning top forms is key to the information it provides us.
In this example because the spinning top is formed within a very congested and sideways range, then we can expect to see more sideways movement. This is because when price action is in a range neither the bulls or bears have control. Price is simply rotating higher and lower in a tight tug of war. The spinning top shows the same information just over one candlestick and not many.

Is the Spinning Top Bullish or Bearish?
Strictly speaking the spinning top chart pattern is not a bullish or bearish pattern. Unlike other patterns such as an outside bar that may be signalling a new strong reversal, the spinning top is signalling indecision.
With that said, depending on where the spinning top forms it can signal a new potential bullish or bearish move.
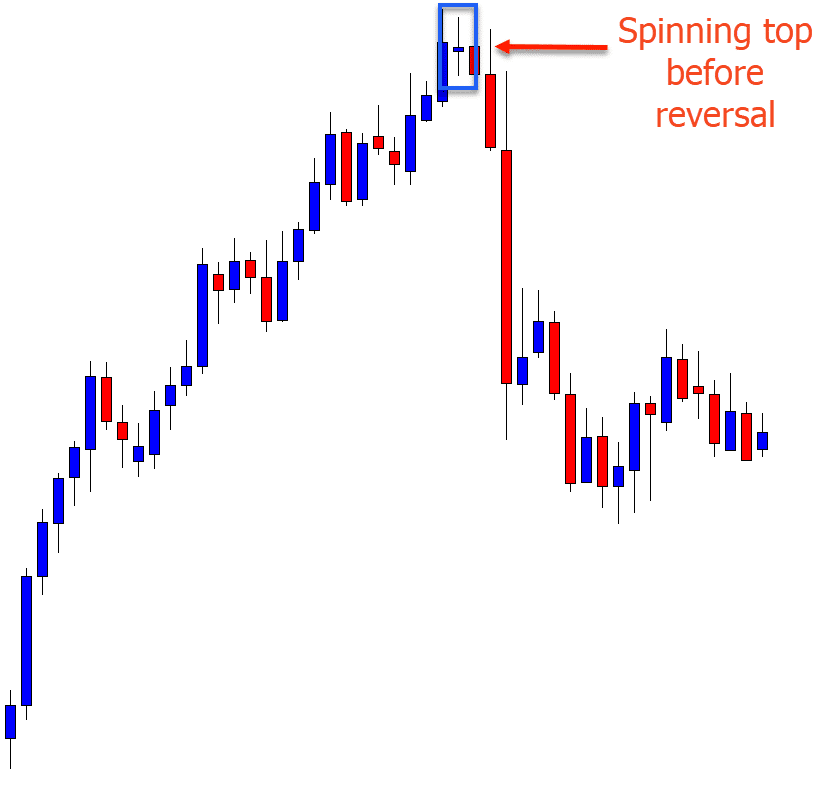
See the example below. With this example the key thing to note is the price action that had formed beforehand. Price had been in a very strong move higher. In this example the spinning top signals a new potential reversal lower.
The important thing is the confirmation and where price breaks in the following sessions following the spinning top. With this example we can see that price makes a new strong break back lower.

How Do You Trade the Spinning Top Pattern?
Whilst you can use the spinning top as a potential trade entry candlestick similar to how you could use an inside bar, it is best used for the information it provides.
Understanding that where the pattern forms and in what type of price action situation it forms is key.
With this information you could then start to look for new potential trades in the coming sessions or you could manage any other trades you have open.
An example of this could be when you see a spinning top formed within a range and tight sideways movement. This could signal to you that more sideways movement is coming and you could start to look for new range trades.
Another example would be using the spinning top to manage your trades. An example of this could be if you were in a long trade and after a strong move higher price forms a spinning top. This could be your clue to either start trailing your stops into profit or moving your stop into breakeven in case price makes a quick reversal.


Leave a Reply