The triple top pattern is a candlestick pattern you will be able to spot and use in your trading on all time frames and in many different market types.
This pattern is very easy to identify and can help you both make and manage your trades.
In this post we go through exactly how to find the triple top pattern and how you can use it in your own trading.
What is the Triple Top Pattern?
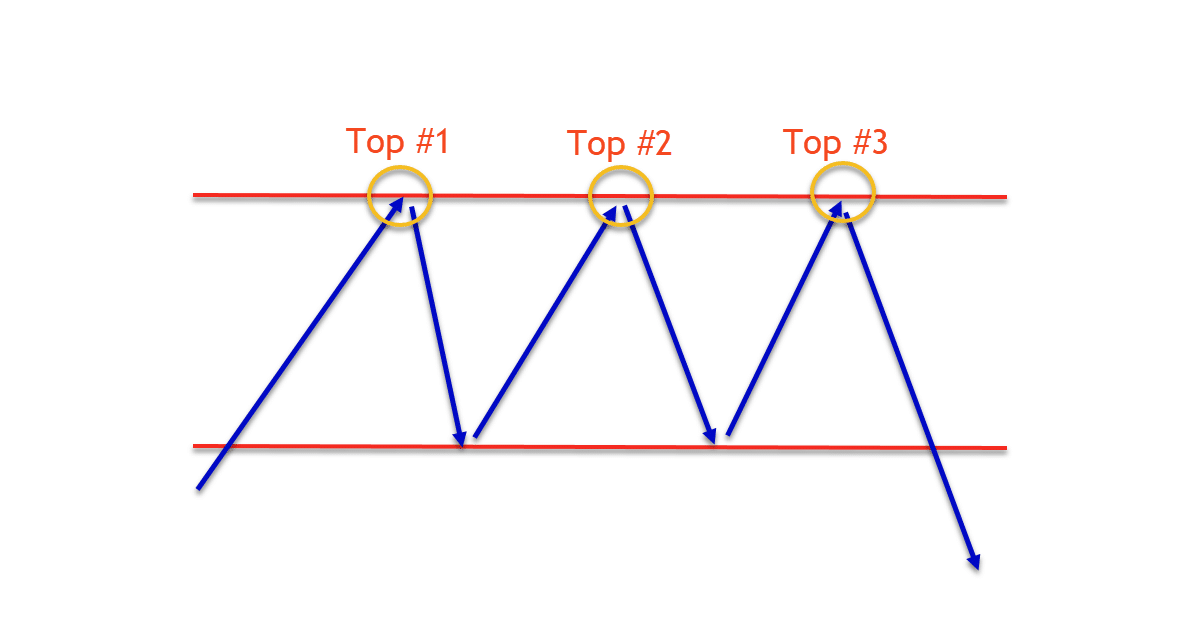
The triple top pattern is formed with three peaks or swing points and a neckline.
The three peaks and the three ‘tops’.
Just like with a double top pattern these peaks need to be rejecting the same resistance level. Whilst you need to keep in mind resistance levels are zones and not perfect lines, these three tops cannot be rejecting three wildly different levels.
In the example below you can see how price moves into the same resistance three times and at each time price moves back lower.

How to Identify the Triple Top Pattern?
You will be able to find the triple top pattern on all of your time frames. It is a pattern that forms regularly and can be very reliable to trade when done correctly.
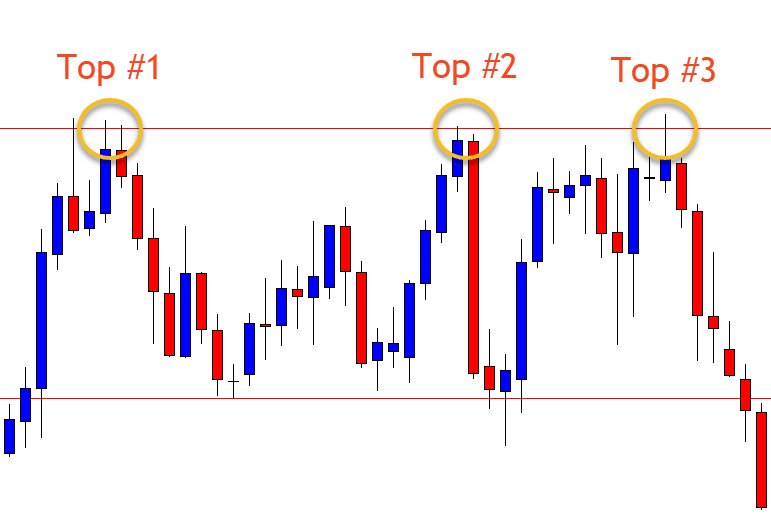
In the example below you will see how price moves higher three times and each time it does it rejects the same resistance level.
After the third ‘top’ price moves back lower for an extended move.
This pattern has a neckline. This is the point where price has been finding support after selling lower from the tops. For the pattern to complete price must break lower and through the neckline after it has rejected and formed the third peak.

Is the Triple Top Bullish or Bearish?
The triple top is a bearish reversal pattern.
As we go through just below, you can use this pattern as aggressively as you like. Whilst most traders use it to enter new trades, you can also use the information it provides to manage any open trades.
How Do You Trade the Triple Top Chart Pattern?
You have two options when trading this pattern depending on how aggressive you are as a trader.
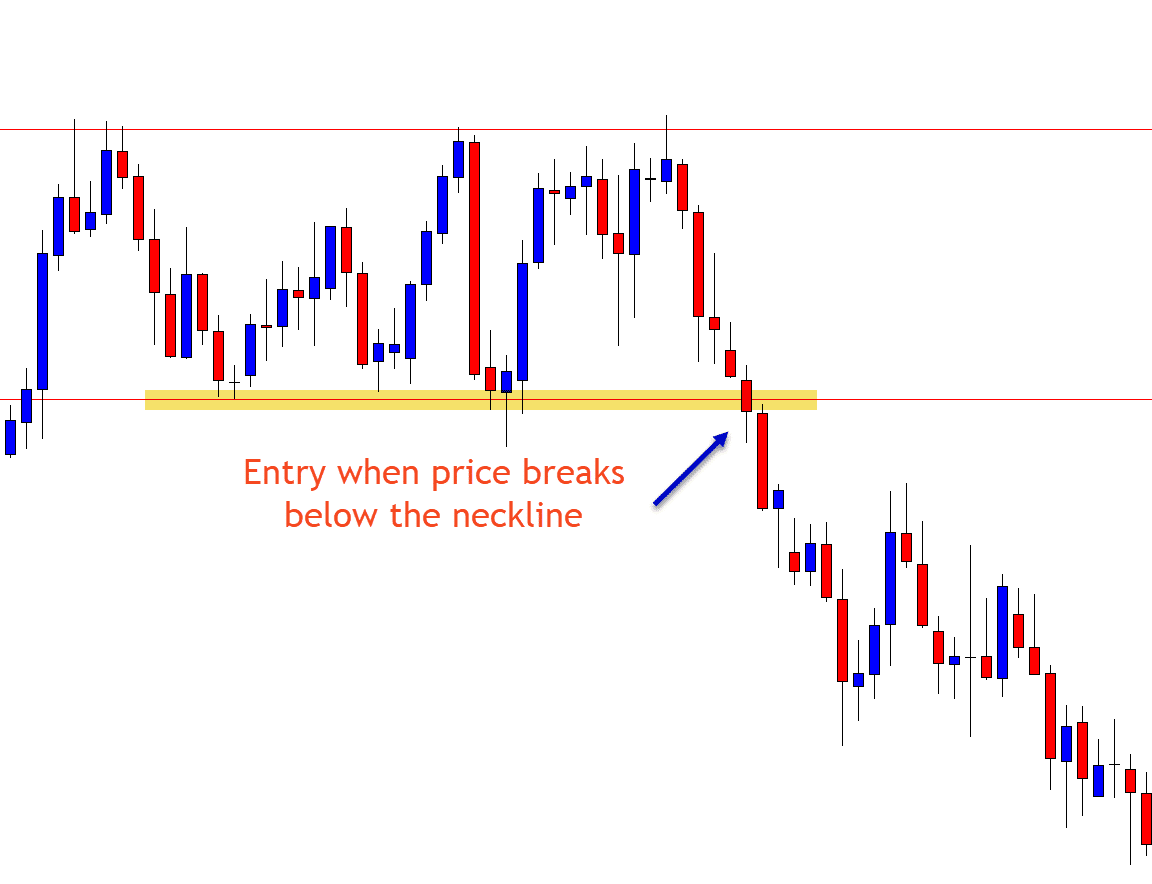
The standard and most conservative way to trade the triple top pattern is looking for an entry when the neckline of the pattern breaks.
Once you notice that price has formed the third top you are then watching for price to fall back lower and into the neckline area. When the neckline breaks this is your signal to enter short trades.

The more aggressive and also more risky trade entry is looking to take a short trade as price is forming the third top.
This is much riskier as price can often breakout after making multiple attempts at the same level.
To increase your chances of making a winning trade entering this way you could use a bearish reversal candlestick at the third top area to confirm that price is in fact looking to reject the resistance and sell back lower.
Where to Set Stops and Profit Targets
Where you set your profit and stop loss orders will depend on the type of trade entry you take.
If you take the aggressive trade entry, then you can often have a tighter stop loss level. You also will not have to look for the neckline to break for a large reward trade.
For example; if you make a short trade at the third top using a bearish reversal candlestick such as a bearish pin bar, then you could put the stop loss above the pin bars high.
You could then target the neckline as your profit target area.
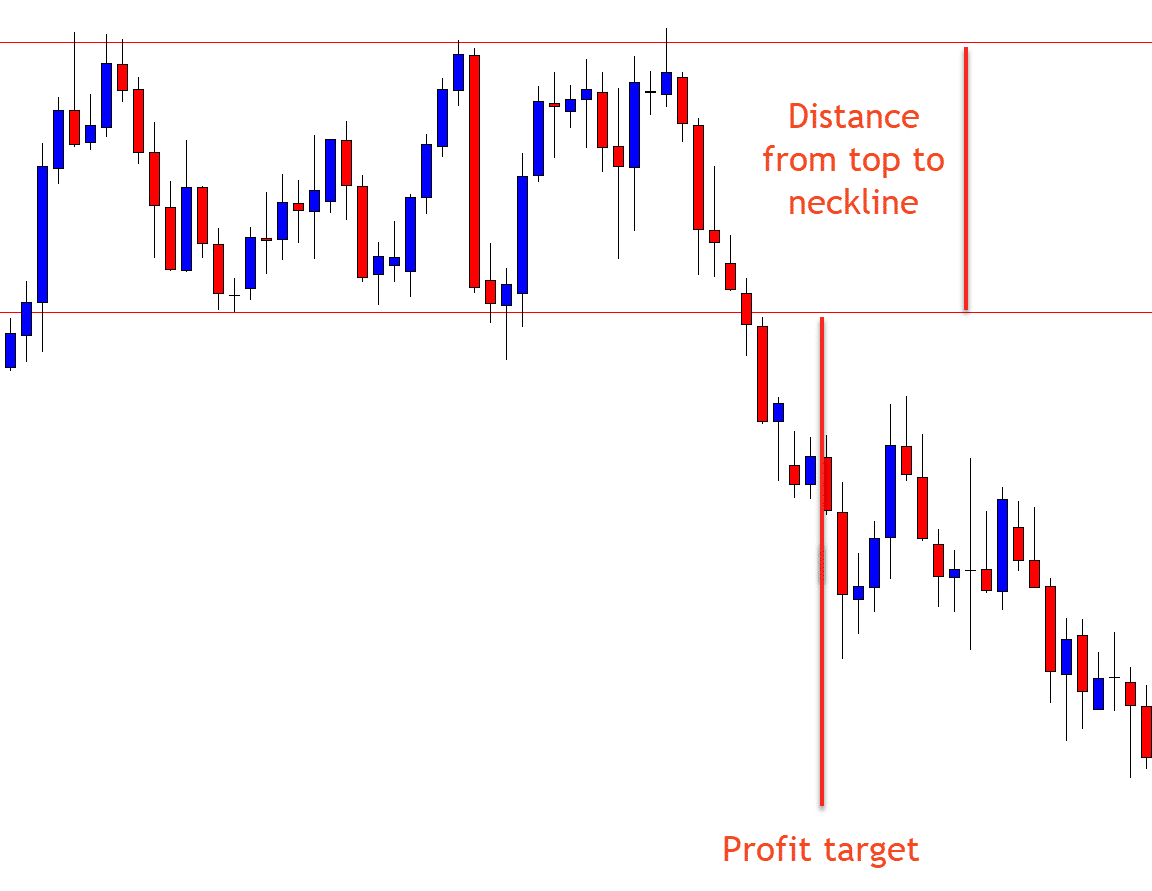
With the standard entry of taking an entry when the neckline breaks you can look for price to move twice the distance that price has moved between the top and the neckline.
See the example chart below. After breaking lower, price moves twice the distance that price had been trading between the triple top and the neckline area. You could use this for your target.
Your stop loss could be placed above the neckline resistance area so that if price does fail and move back above the neckline you would quickly be stopped out. This would also allow for a potentially very large reward trade.


Leave a Reply