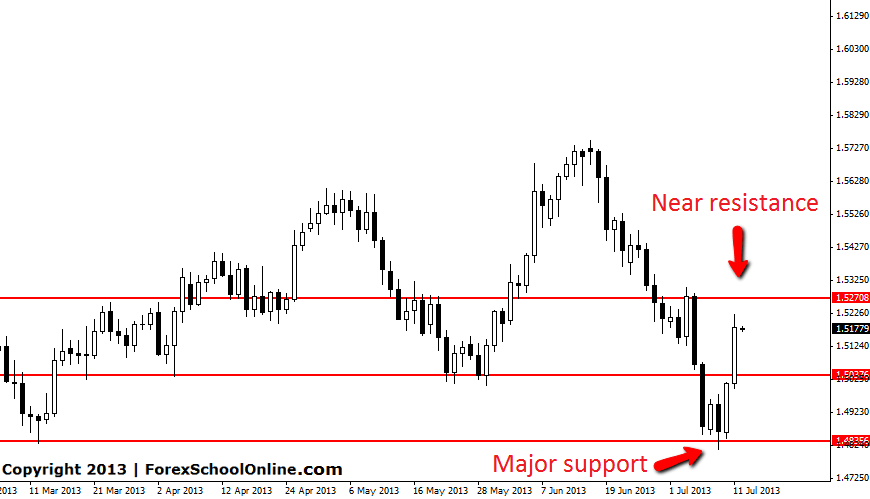
The GBPUSD has pushed substantially higher over the last two daily sessions to push back into the range that it has been trading in over the past few months. Price on the daily chart has been trading sideways with no clear direction or trend in either direction. Price had moved down to the major support area which was tested for a possible breakout. If this level broke out we could have seen the start of a new down-trend and the end of this multi month range, but the range low held and this sideways price action continues for the foreseeable future.
When trading ranges we need to trade from the best areas and not get caught out in no man’s land. Price is now moving higher into the recent resistance area around 1.570. The last time price test this area price formed a two bar reversal before selling off heavily and moving lower into the major support level. This time the bullish momentum is very strong and we are going to have to watch the price action clues to give us hints to what price is wanting to do.
In our recent video we discussed this market in depth and how to trade not only range markets but also trending markets. To watch the video see here: Increase Your Win Rate by Learning How to Trend Trade Forex | Trading Tutorial
GBPUSD DAILY CHART | 12TH JULW 2013


Leave a Reply