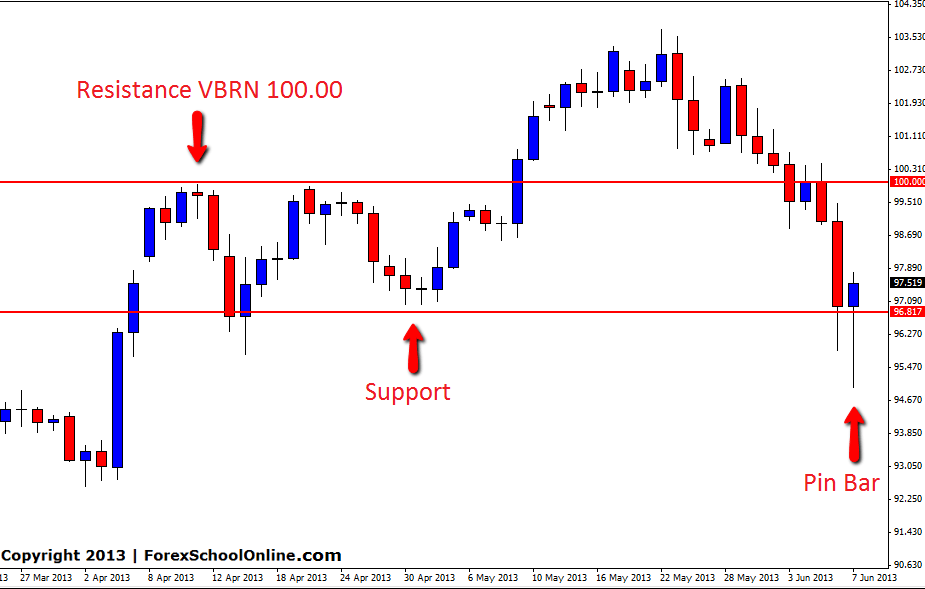
The USDJPY has formed a Pin Bar in-line with the trend. This up-trend has been in place for an extended period of time and in this blog we have covered many Japanese pairs over the past six months with price action setups. We have also made an in depth trend trading tutorial to teach traders exactly how to take advantage of these obvious trends such as the one here on the USDJPY. You can read this trend trading tutorial HERE.
The Pin Bar here on the USDJPY is down at a swing low and also rejecting a solid support level. This support level is a proven level that has been tested in the past as both a resistance and support level. The reason horizontal levels are the best and most logical levels for traders to work with are because they are proven. As you can see from this level on the chart below, this level is a proven level that has held many times for price to bounce in between.
If price moves higher and breaks the Pin Bar high the next major resistance level comes in around the Very Big Round Number of 100.00. Very Big Round Numbers can act as psychological levels in the market. If price fails and moves lower we may see the end of this up-trend and price may collapse, falling lower. If this happens it may be the first time in a long time to start looking for short trades in this pair.
If you want to learn any of the advanced methods that we don’t discuss in public such as breakout trading, continuation trading, advanced money management & trade management, check out our members only area and course page HERE. If you have any questions you can contact me HERE.
USDJPY DAILY CHART | 9 JUNE 2013


Leave a Reply