Weekly Price Action Trade Ideas – 17th to 21st Feb 2020
Markets Discussed in This Week’s Trade Ideas: EURUSD, EURGBP, NZDJPY and GOLD.
Note: We Use Correct ‘New York Close 5 Day Charts’ – You can read about why we use these and how to download the correct free charts at Correct Free New York Close Demo Charts
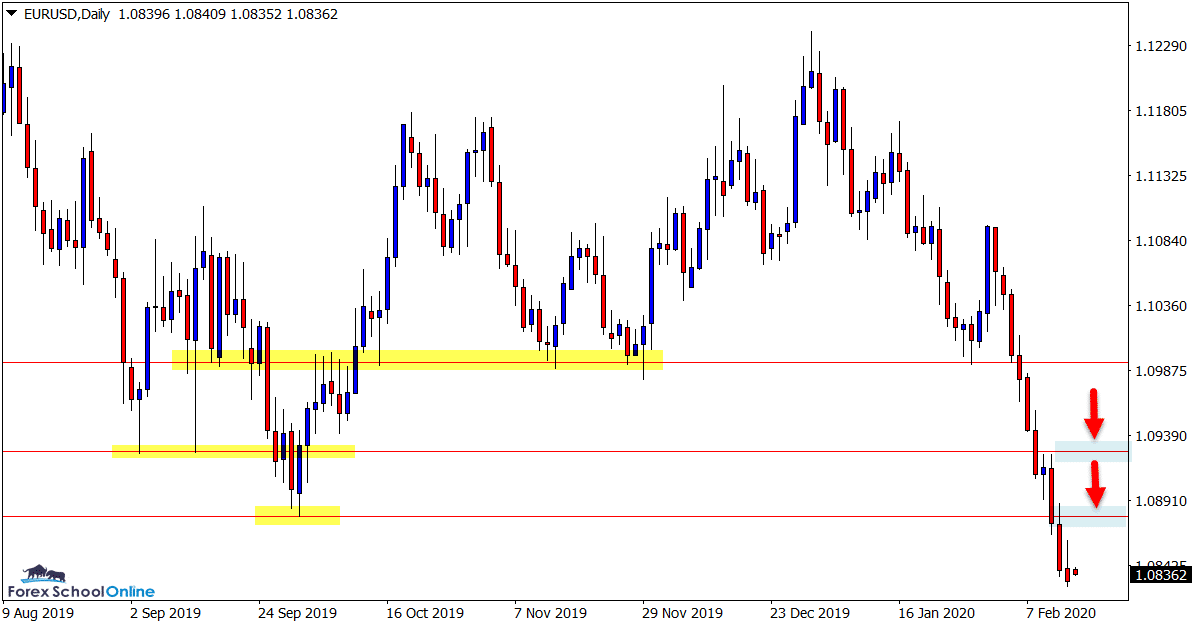
EURUSD Daily Chart
Watching for Any Pullbacks Into Resistance
In last weeks trade ideas we were charting this pair to see if price could either rotate higher for a potential short sell or if it would test and potentially break the near term support.
With price having now smashed through the near term support and also broken another level of support the momentum is all lower.
The EURUSD is a chart we have been watching and charting for many months waiting for a solid break and then for some clean free flowing price action.
Now that it is happening it could open the door to a lot more trading opportunities on both the daily and smaller time frames that for long periods in 2019 were not there due to price being stuck in its range.
Daily Chart
EURGBP Daily Chart
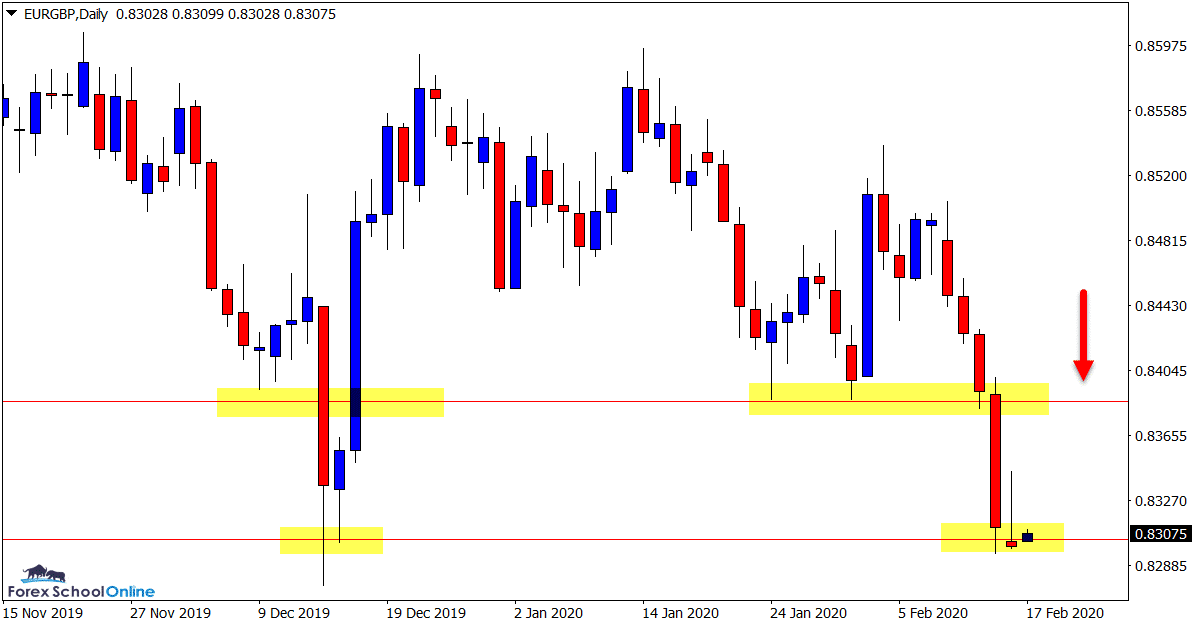
Inverted Pin Bar Could Pop Prices Into Resistance
Price on the daily chart of the EURGBP has formed an inverted pin bar at the recent swing low and support area that could see price pop higher.
If that is the case and price can rotate higher, it could move into the overhead old support and potential new price flip resistance level.
This could be a solid level to watch for high probability short trades on the daily and smaller time frames like the 4/1 hr charts.
Daily Chart
NZDJPY Daily and 4 Hour Charts
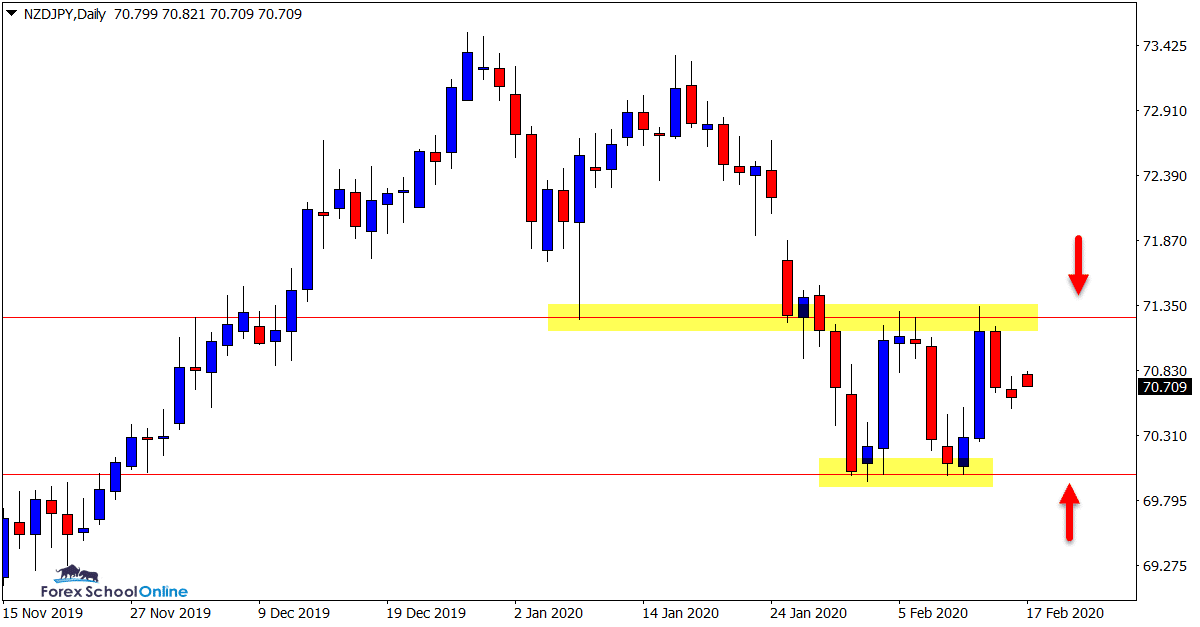
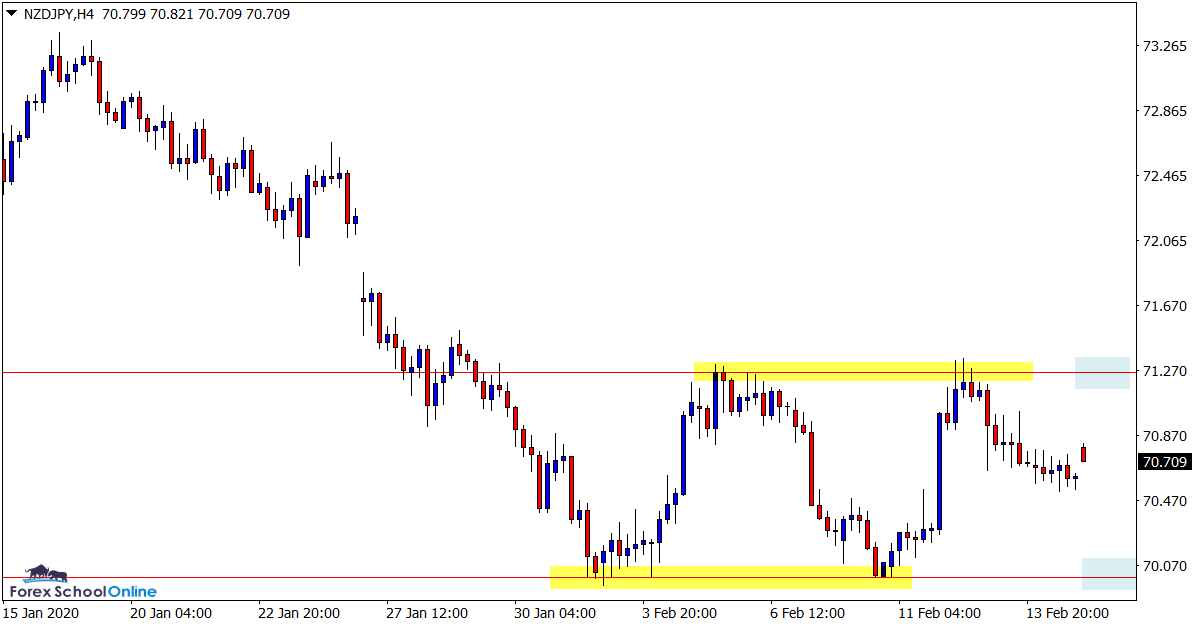
Clear Range Boundaries in Play
There looks to be a clear range and box in play on the NZDJPY pair.
As both the daily and 4 hour charts show below; price has well defined support and resistance levels that have held firm at recent tests.
Until a breakout occurs, both the support and resistance of this box/range could be watched for potential price action triggers.
Daily Chart
4 Hour Chart
GOLD Daily Chart
Could the Consolidation Break?
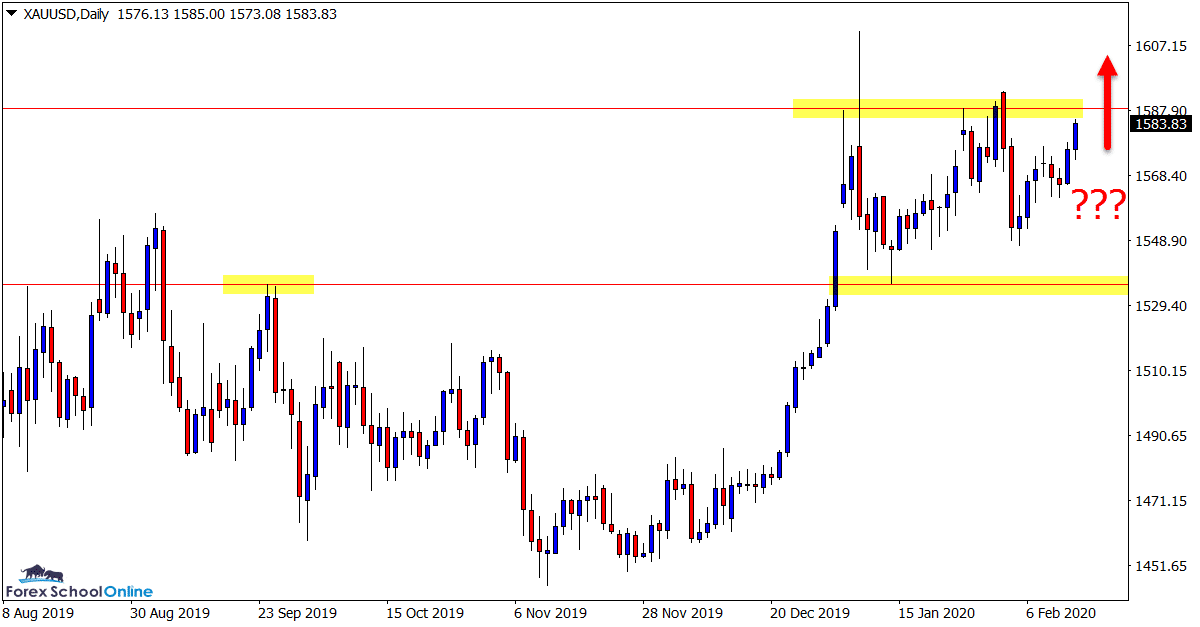
Whilst we have been discussing Silver in recent times, the Gold market is in a similar situation.
As the daily chart shows below; after a large move higher price has been consolidating and moving sideways for the past few weeks.
The next few sessions could be important for this market as price rotates higher into the close overhead resistance.
If we can get a breakout higher, then a lot of potential trades will open up such as straight breakouts or breakout and quick retests on the smaller time frames.
Daily Chart
Trade Ideas Note: All views, discussions and posts in the ‘charts in focus trade ideas’ are the view of Forex School Online and are not recommendations or trading advice. All posts are general in nature and are not advice to buy or sell.
Note: We Use Correct ‘New York Close 5 Day Charts’ – You can read about why we use these and how to download the correct free charts at Correct Free New York Close Demo Charts
Please leave questions or comments in the comments section below;


Hi Yaacov,
yes, that was a solid rejection that saw price sell off back into support.
Since then we have been consolidating and within this box have also formed a higher low building possible momentum to test the resistance.
Johnathon
Hi Johnathon
Is not the Bearish Engulfing in GOLD (almost pin) that reached 1306 at the beggining of the year a clear reversal sign?