Weekly Price Action Trade Ideas – 2nd to 6th Dec 2019
Markets Discussed in This Week’s Trade Ideas: EURUSD, NZDUSD, EURGBP and AUDSGD.
Note: We Use Correct ‘New York Close 5 Day Charts’ – You can read about why we use these and how to download the correct free charts at Correct Free New York Close Demo Charts
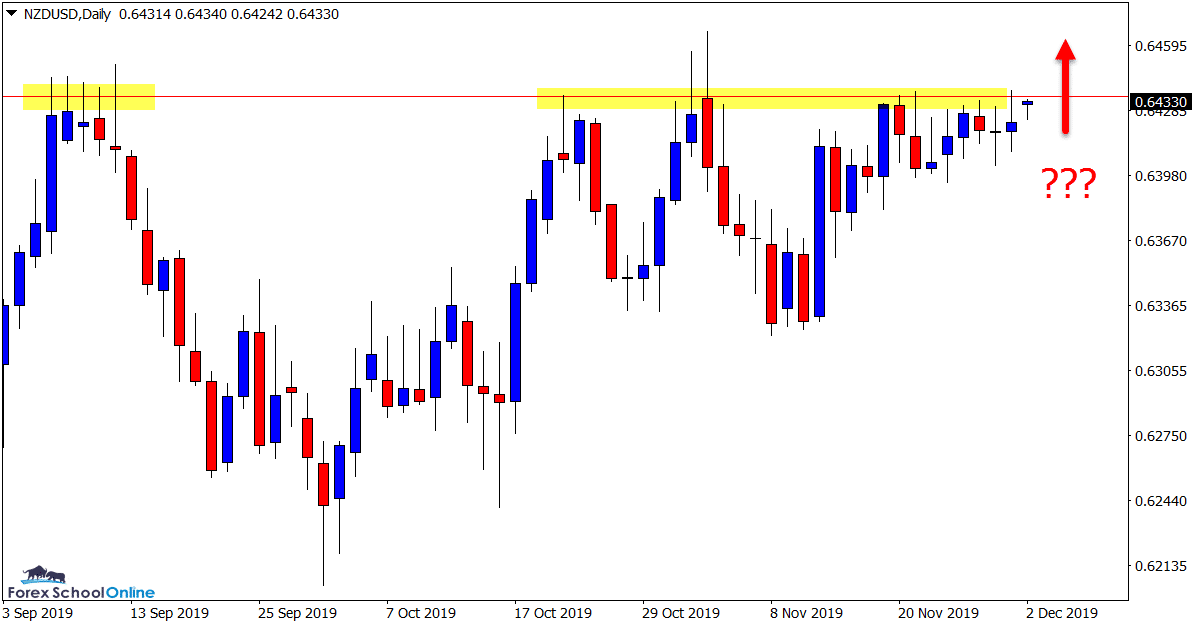
NZDUSD Daily Chart
Watching for Breakout
Similar to the NZDJPY we discussed in last week’s trade ideas, the NZDUSD looks like it could be building for a break higher.
In the last few sessions we have seen price stall and whilst the resistance is still holding at this stage, the selling has been weak when rejecting the resistance.
If price can make a clear break higher, it could pave the way for potential breakout trades and a move into the 0.6490 area of next resistance.
Daily Chart
EURUSD Daily Chart
Bullish Engulfing Bar
Price on the EURUSD has formed a bullish engulfing bar on the daily chart.
As we have discussed in recent times when looking at this market; price is in a sideways range with no clear direction or trend.
If price holds at the support and the engulfing bar breaks higher we could see price roll into the above resistance area. Because of the sideways market this could also be a solid level to watch for potential bearish trades.
Daily Chart

AUDSGD Daily Chart
Will Price Continue?
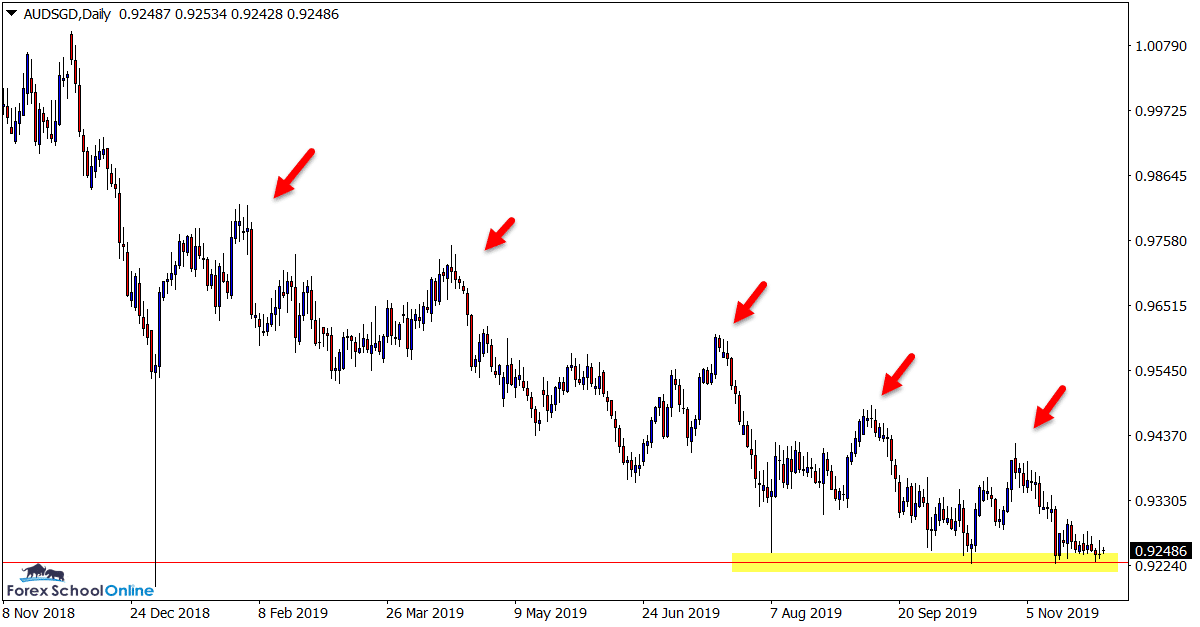
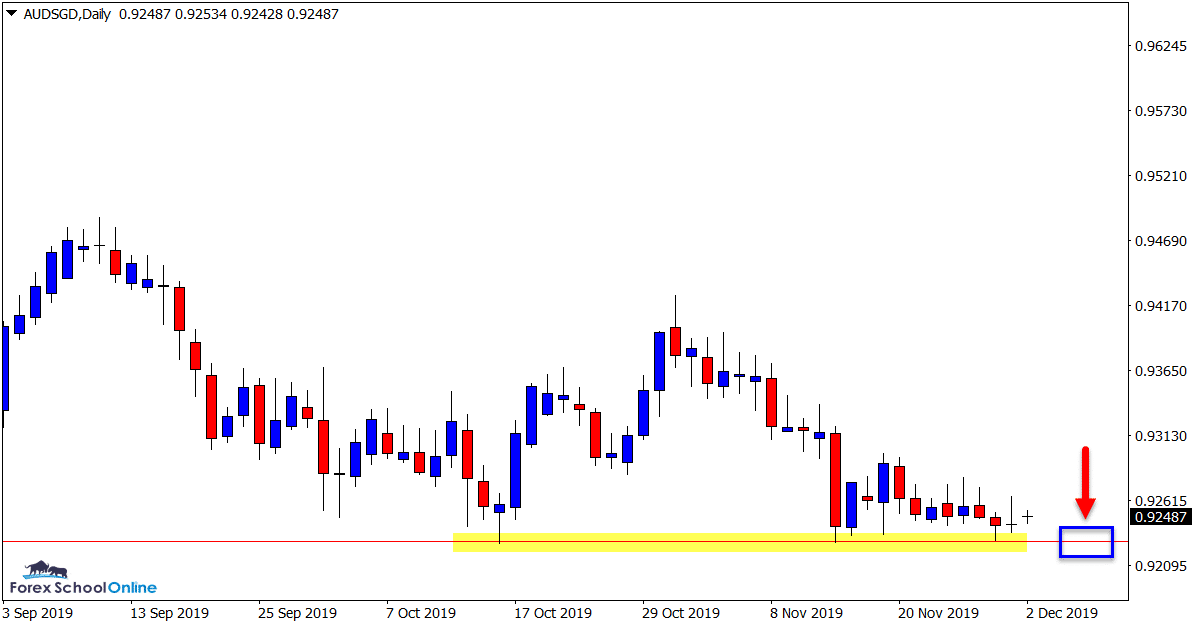
This is one of the few pairs that in recent times has shown a clear direction with price heavily selling off lower.
As the zoomed out chart shows below; price has formed a series of consistent lower highs and formed a clear move lower.
This has been halted just recently with the major daily support level holding.
If this gives way we could see a continuation pattern play out and a lot of potential trade opportunities open. These could be breakout or quick intraday breakout and re-test trades.
Daily Chart
Daily Chart
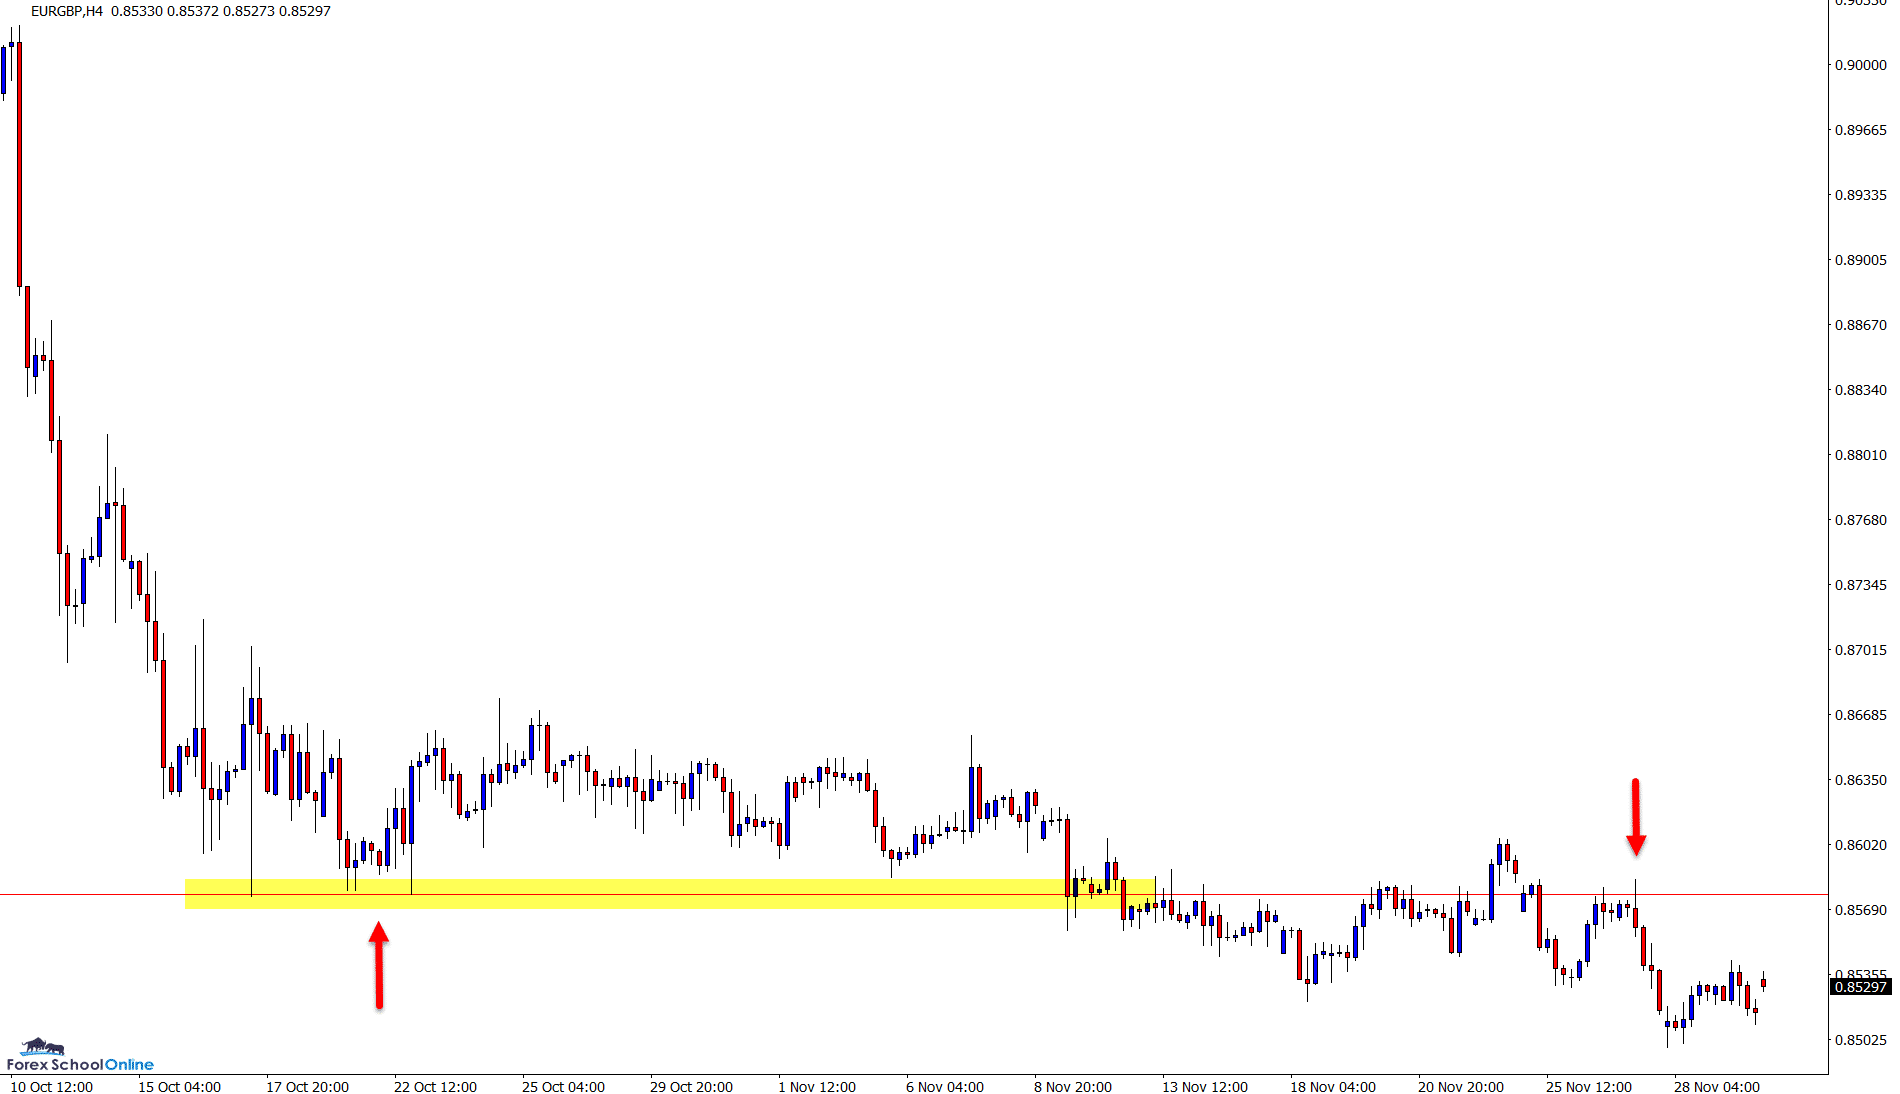
EURGBP Daily and 4 Hour Charts
Weak Breakout Lower
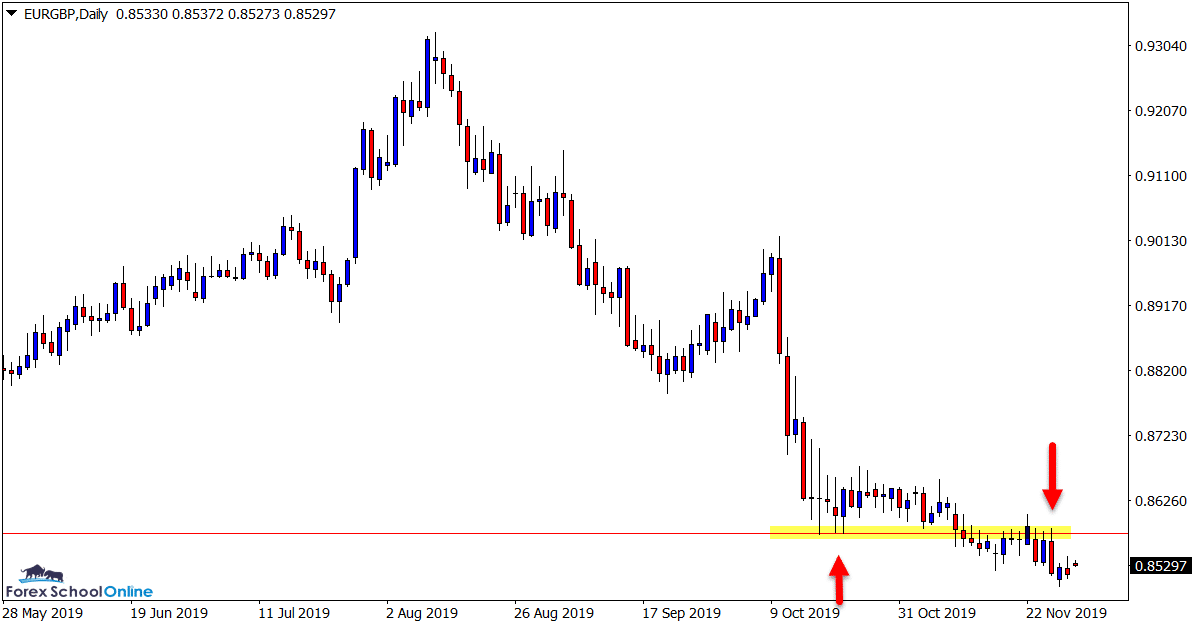
We recently looked at this market for a potential breakout lower and possible breakout trades.
Whilst price did finally break the consolidation and box that it had been stuck trading in, the breakout was weak and typical of some of the breakouts we have been seeing in recent times.
Price has since rotated back higher to test the old support area to hold as a new resistance as the 4 hour chart shows below, but until price forms clearer price action I am happy to watch it unfold.
Daily Chart
4 Hour Chart
Trade Ideas Note: All views, discussions and posts in the ‘charts in focus trade ideas’ are the view of Forex School Online and are not recommendations or trading advice. All posts are general in nature and are not advice to buy or sell.
Note: We Use Correct ‘New York Close 5 Day Charts’ – You can read about why we use these and how to download the correct free charts at Correct Free New York Close Demo Charts
Please leave questions or comments in the comments section below;


👍👍
thank you so much sr.