How to Find and Trade the 123 Trend Reversal Pattern
The 123 trend reversal pattern is super simple to spot, occurs frequently in the markets and can be a powerful price action clue.
When traded correctly the 123 pattern can be used to identify market reversals, potential trade entries and to help with trade management.
In this lesson I go through exactly how to find the 123 reversal and how you can use it to great affect in your trading.
What is a 123 Trend Reversal Pattern
As the name implies the 123 trend reversal has three parts. This pattern can be used for either bullish or bearish reversals, but the same three parts must form.
In the image below I have drawn an example to highlight how a basic bullish 123 reversal pattern is created.
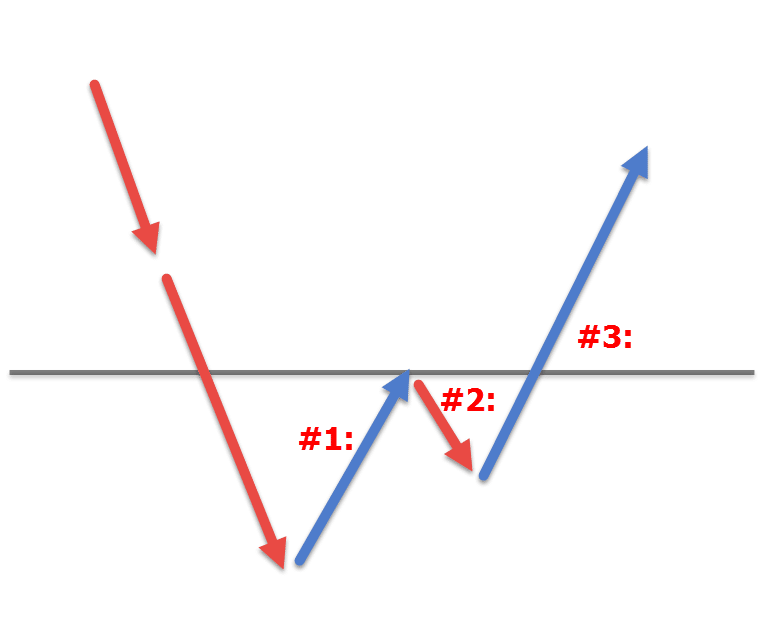
Price is moving lower in a downtrend before forming part #1. This is a move back higher against the trend or overall move currently in place. Part #2 is a move inline with the trend, but crucially a new higher low is formed. For a bearish 123 reversal this would be a new lower high. Part #3 sees price make a new move back higher and importantly break the recent swing high of part #1.
That may sound confusing, but with a little time spotting them on a chart it will soon become clear.
How to Identify a 123 Reversal
Below is a real chart of a 123 bullish trend reversal taking place.
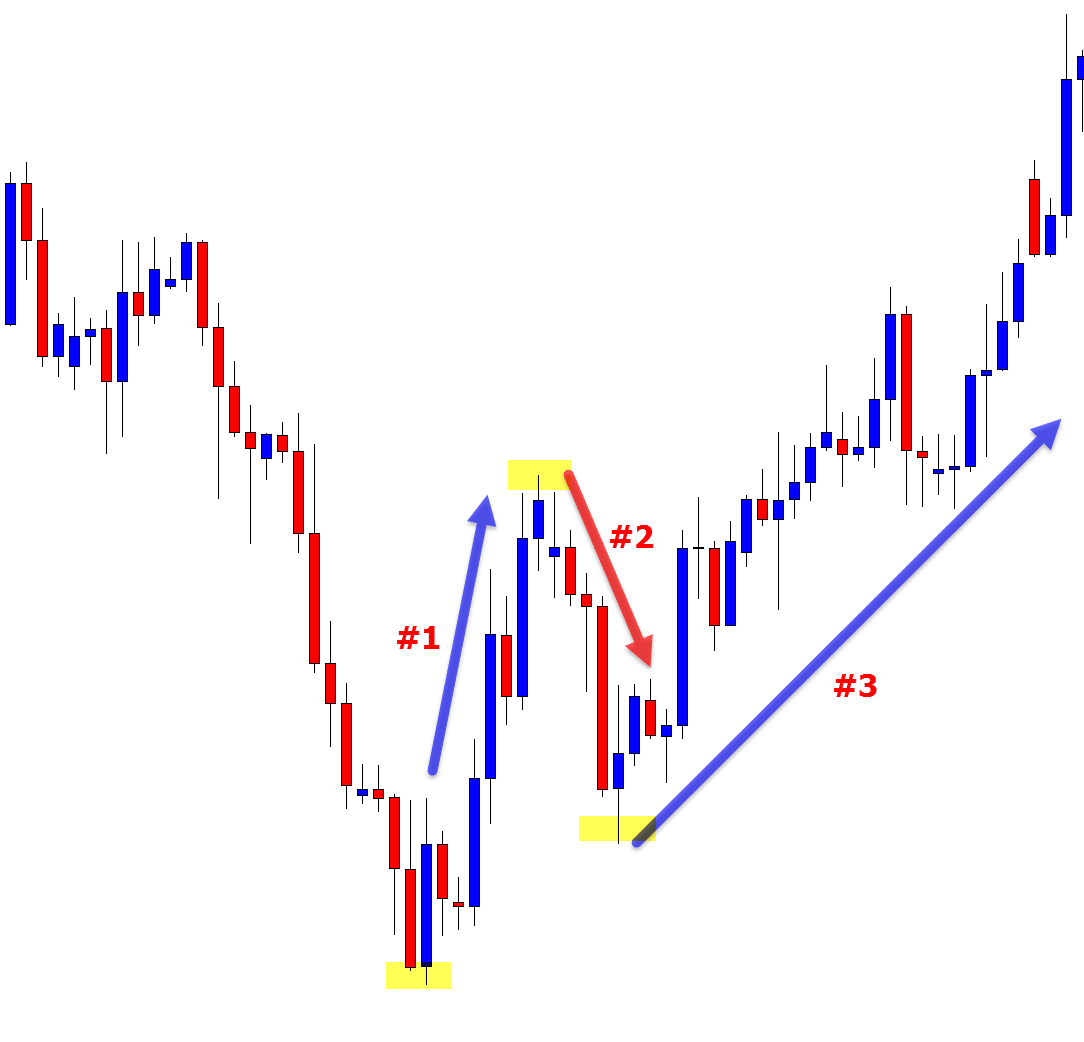
Price had heavily sold off lower before forming part #1, the move back higher.
In part #2 price rotates lower, but this time we have a new higher low.
The 123 pattern is completed when price makes move #3 and moves above the recent swing high.
Note: some traders using the 123 reversal don’t wait for the recent high or low to break, but for the pattern to confirm we need to see price move above or below.
Below is an example of a bearish 123 reversal taking place.
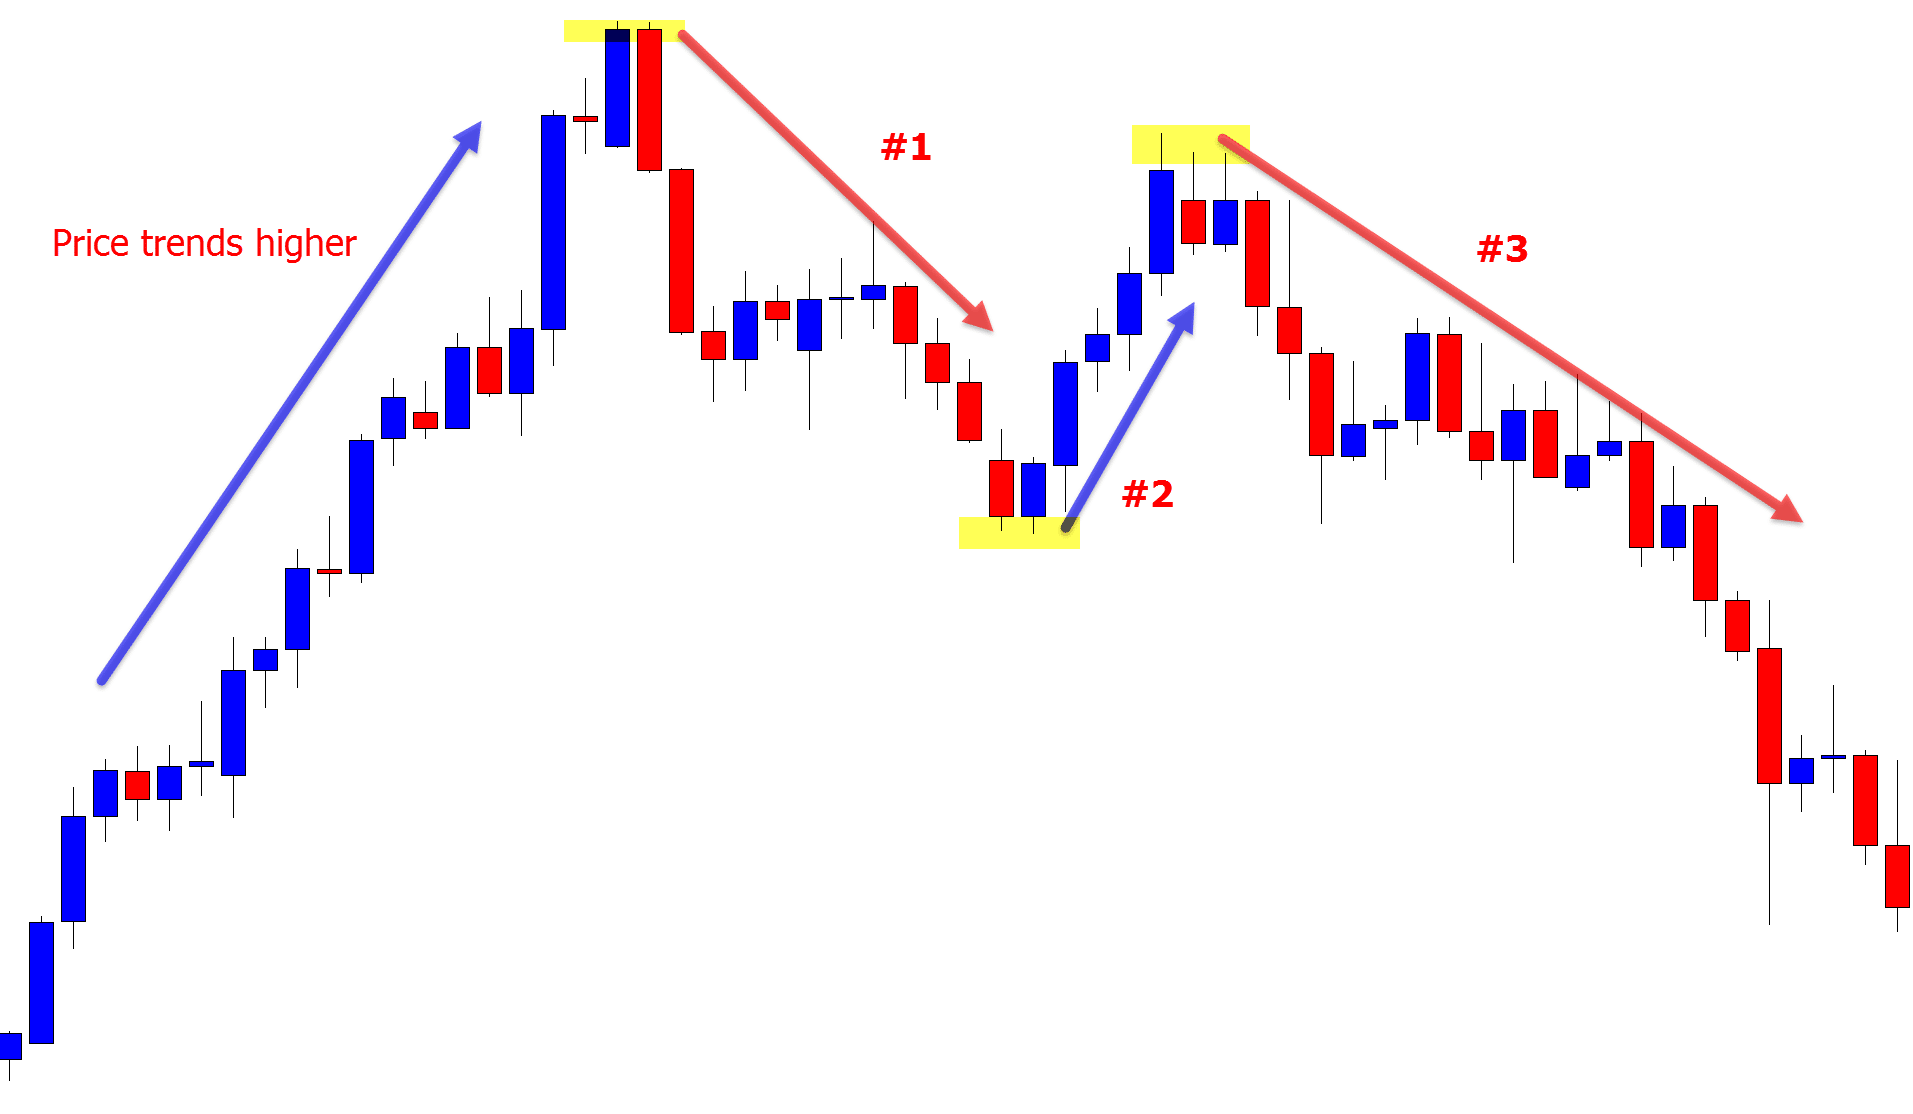
This has the same three parts as the bullish example shown above, but in reverse order.
After price was trending higher it formed a quick move lower. The trend does not continue as we get a new lower high. The 123 pattern is then confirmed when price breaks lower and through the recent swing point.
How You Can Use and Trade the 123 Reversal
The 1,2,3 pattern is best and most commonly used to spot trend reversals, but you can also use it to identify when a range is breaking and to help you look for potential trade opportunities.
Using to Identify Major Range Breakouts
Whilst commonly used as a trend reversal pattern, you can also use the 123 to spot when a range is breaking or looking to potentially break.
This can be incredibly handy if you are a breakout trader or you look to make breakout and quick retest trades. Being able to spot momentum shifting could put you on the right side of the market.
The first chart below is of a ranging market that has just broken lower and through the range support level.
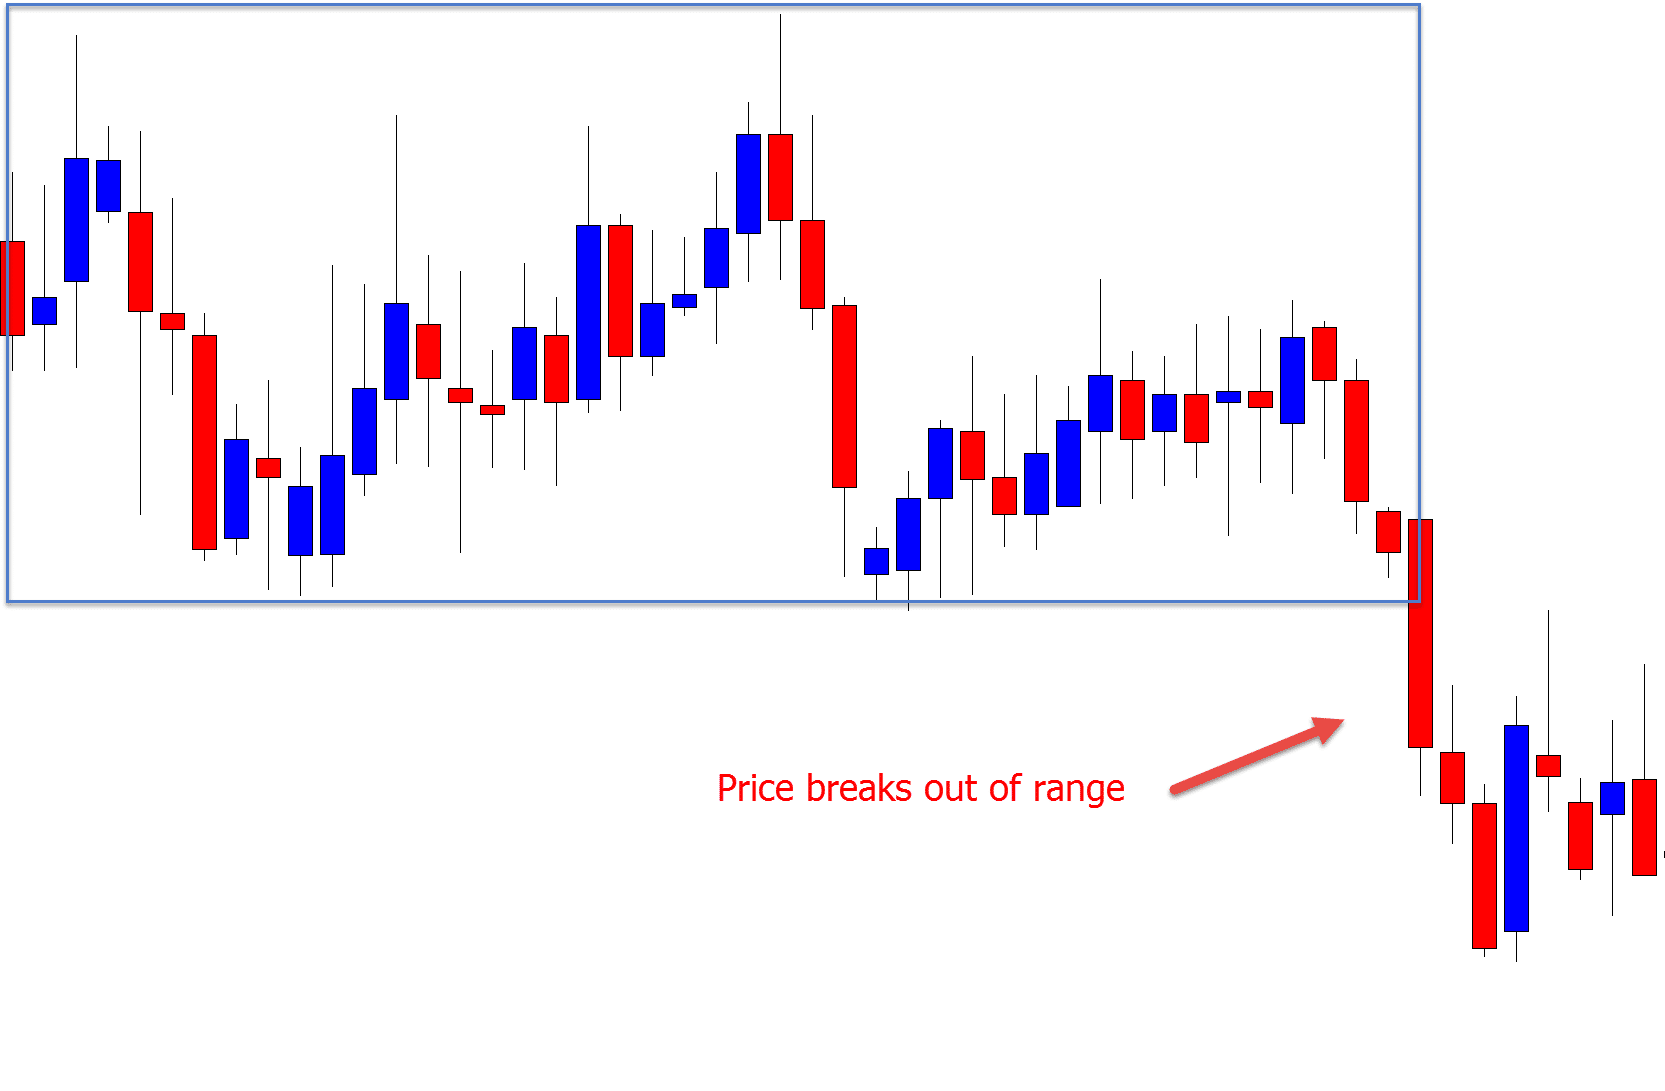
A closer look at the price action before the breakout shows that momentum was building to a breakout lower with a 123 pattern.
Inside the sideways range, price had formed a lower high and was looking to complete part #3 of the 123 pattern with a breakout lower.
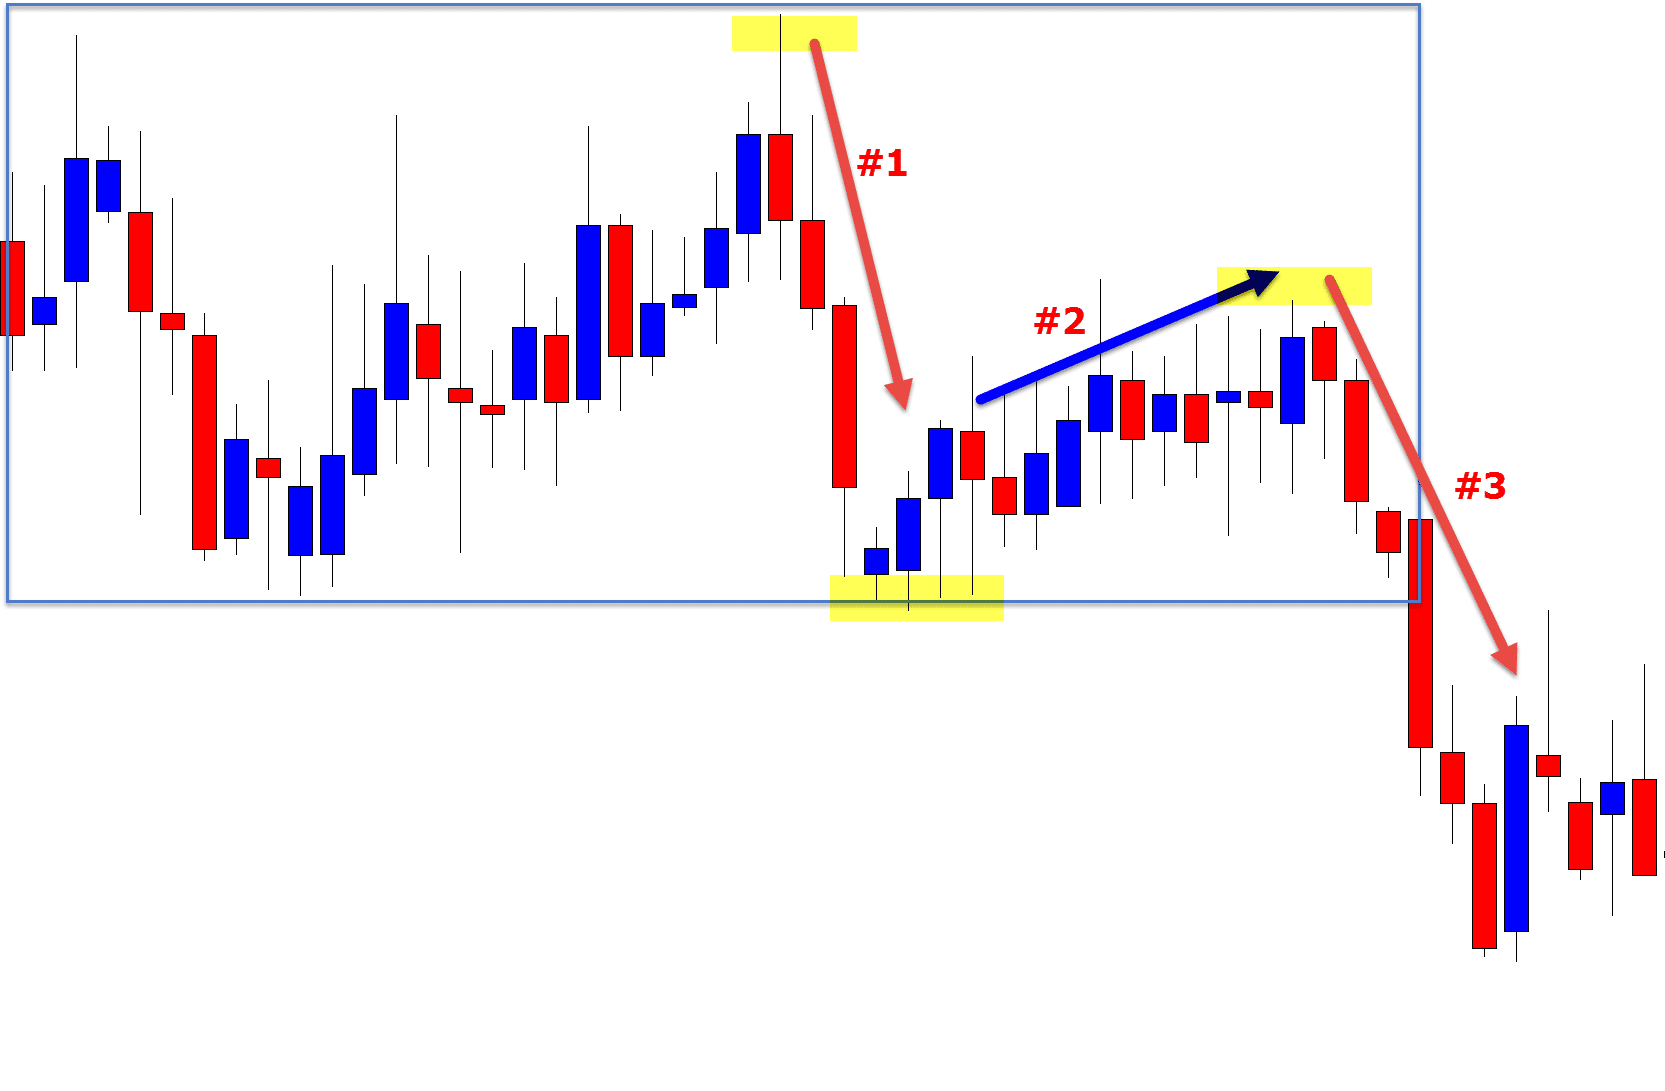
How could this help us? Being able to spot this 123 could help us either look for breakout trades as they are happening, or as discussed below; look for trades when price retests the breakout area.
If you take another quick look at the chart above; you will notice that after price broke out of the range and confirmed the 123 pattern, it made a quick retrace higher. At this retest it rejected the breakout area and formed a bearish pin bar reversal setup.
Using to Spot Market Reversals
Using the 123 pattern as a trend reversal pattern is the most common strategy. The reason for this is because it can help us quickly identify shifting momentum and catch a new trend early.
If we use with other techniques such as double tops and bottoms, recent momentum and key level breaks, then we can quickly spot when a market is looking to reverse.
If we spot a 123 being formed we can then turn to using these other strategies to look for potential trade entries.
Using 123 to Find Trade Opportunities
Whilst this pattern can be used to spot trend and market reversals, it can also be used to spot new potential trade opportunities.
The best way to do this is to watch the level that price confirmed the 123 pattern and see if it holds as a new price flip level.
Because this level has recently been a support or resistance level, it will often flip and hold as a new support or resistance level.
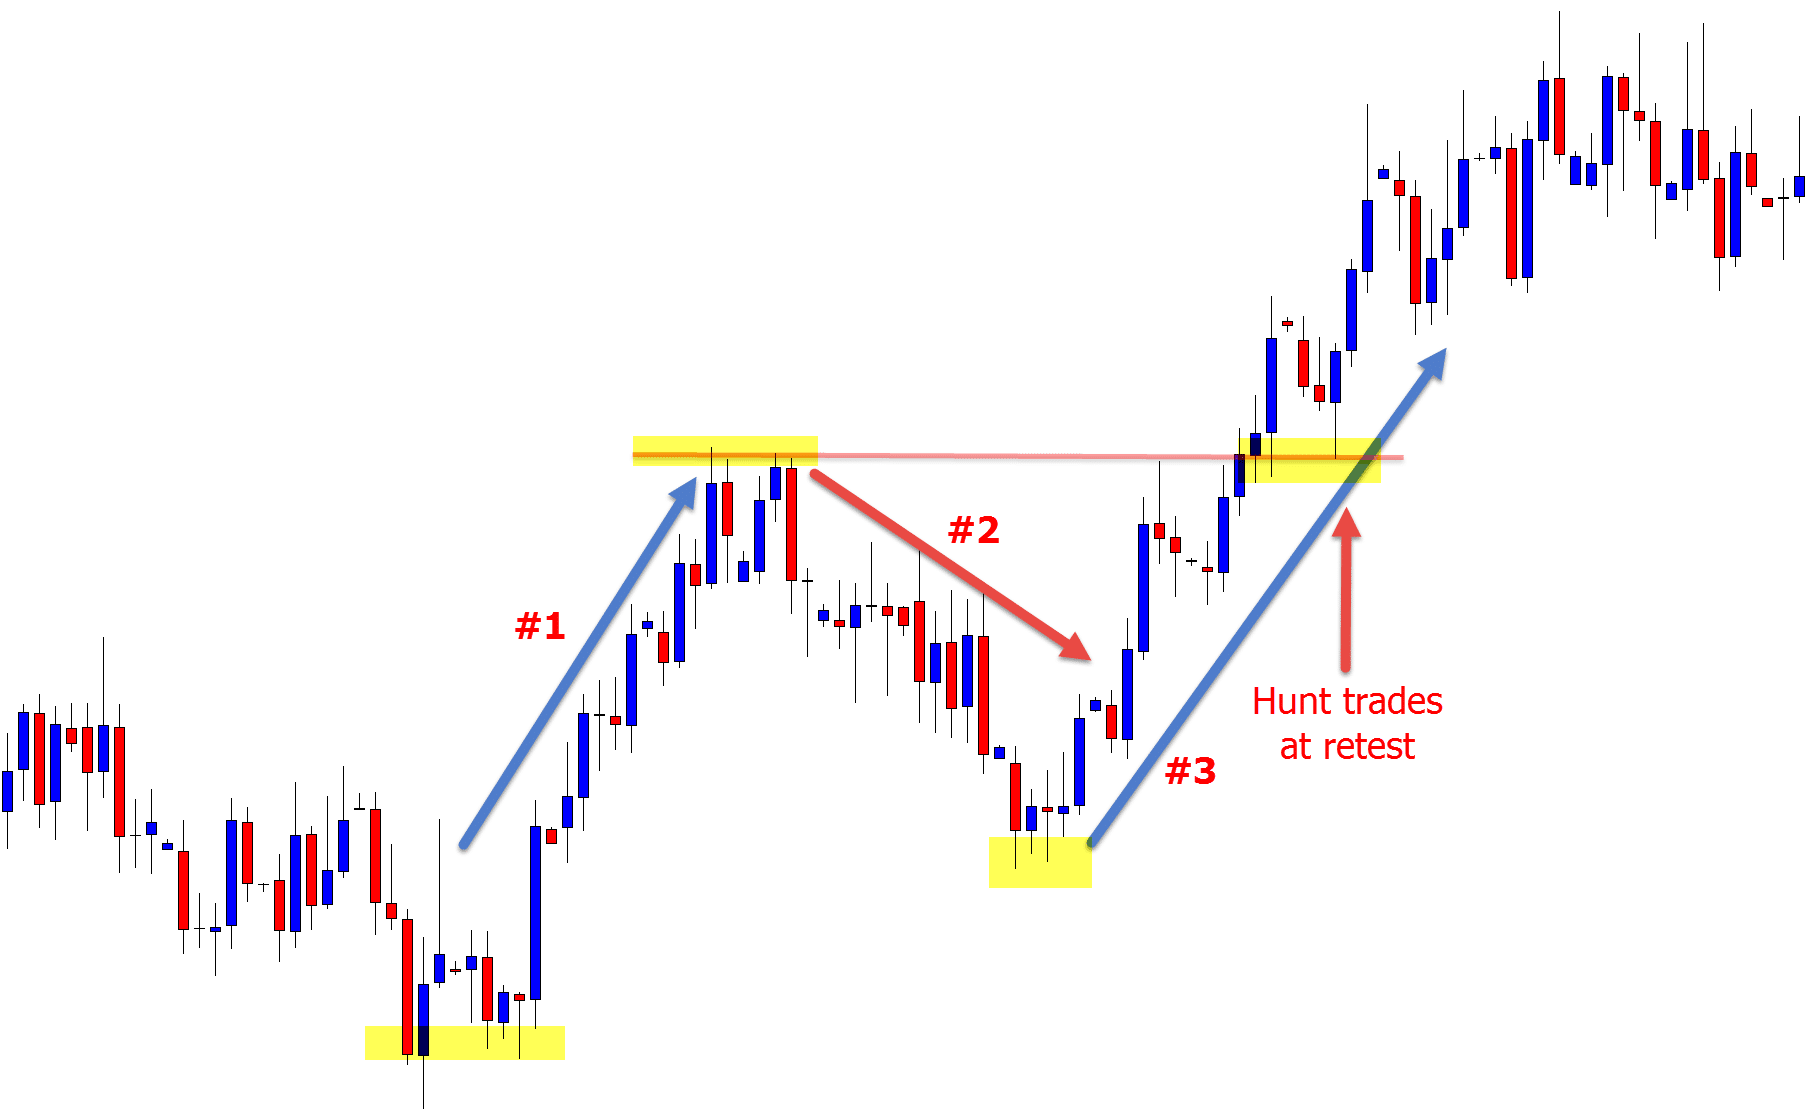
An example of this is below; price formed a bullish 123 reversal pattern, confirming with the breakout higher.
After breaking out higher, price made a quick retrace and retest into the old resistance and new support level.
See the chart example below;
Lastly
Whilst the 123 reversal pattern is a simple three part formation, it can be used in many scenarios and with a lot of other price action strategies.
There are many other strategies you can use to spot when a market is reversing such as when price is building new momentum, creating a base, forming fresh highs or lows and breaking and retesting price flips.
You can read an in-depth lesson into market reversals at How to Spot Price Action Market Reversals
If you have any questions or comments please add them in the section below;
Safe trading,
Johnathon


is there program code to implement 123 rule?
Really informative Johnathon,
Thanks a lot
Dear Johnathon,thank you for great teaching I benefited it and appreciated your simplified teaching.
Is there specific time frame to use the 123 strategy?
Hi Abdirahman,
the 123 can be used on many time frames to identify that particular time frames trend or potential reversal.
Johnathon
Sir can you please help me with signals please
HI Sandile,
I am sure there are plenty of good signal providers out there, but it is not something we do.
Safe trading,
Johnathon
Sir,
It an excellence instruction.
Thanks Firoz 👍
Awesome.
👍👍
I don’t know how could i give you thank. You are really great.
You just did Rehan!
All the success,
Johnathon
Yes. I did. but I learned and I’m completely got it. After a Massive disaster, I came to understand there must have to be a reason before I execute a trade and that is a complete trading plan. I’m learning from the past failure.
you are such a great. and thanks for the prompt positing.