Weekly Price Action Trade Ideas – 1st to 5th April 2019
Markets Discussed in This Week’s Trade Ideas: AUDPY, GBPCHF, EURCAD and AUDNZD.
Note: We Use Correct ‘New York Close 5 Day Charts’ – You can read about why we use these and how to download the correct free charts at Correct Free New York Close Demo Charts
AUDJPY Daily Chart
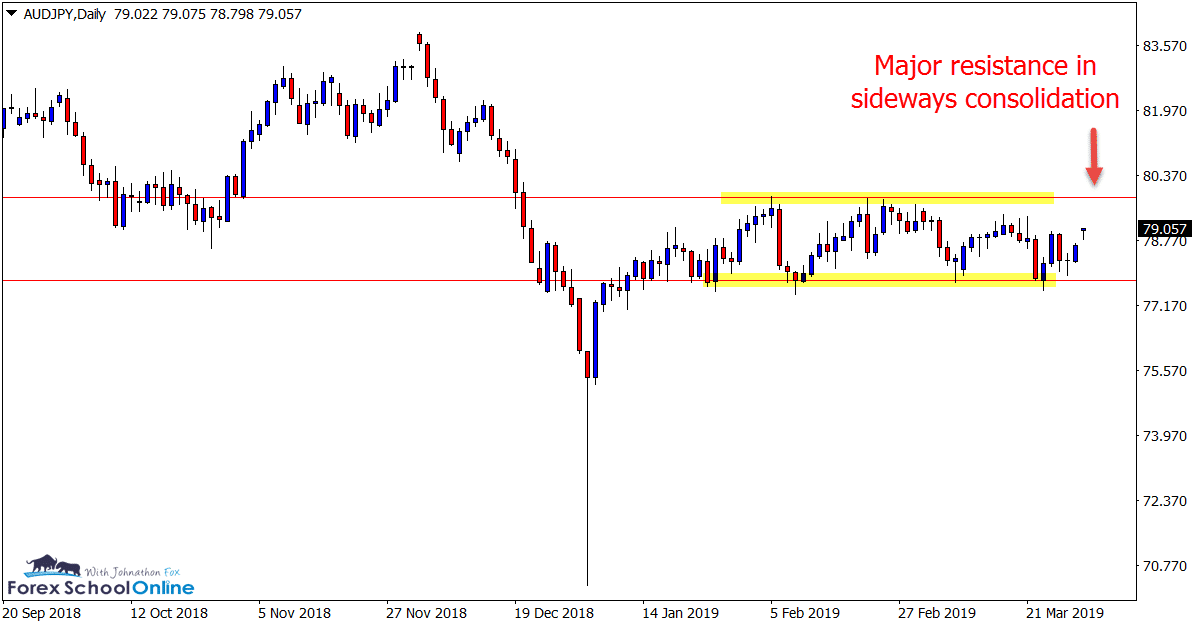
Major Daily Chart Consolidation
Price action on the daily chart of the AUDJPY is stuck moving sideways in a clear consolidation pattern.
As the daily chart illustrates below; this market has a clear high and low that it has been operating in-between with price currently trading in the middle of the range.
If price can make a clear break in either direction, it could open up faster and more free-flowing movements with more trading opportunities.
Until then, targeting the highs and lows of this range for A+ reversals looks the solid play.
Daily Chart
GBPCHF Daily Chart
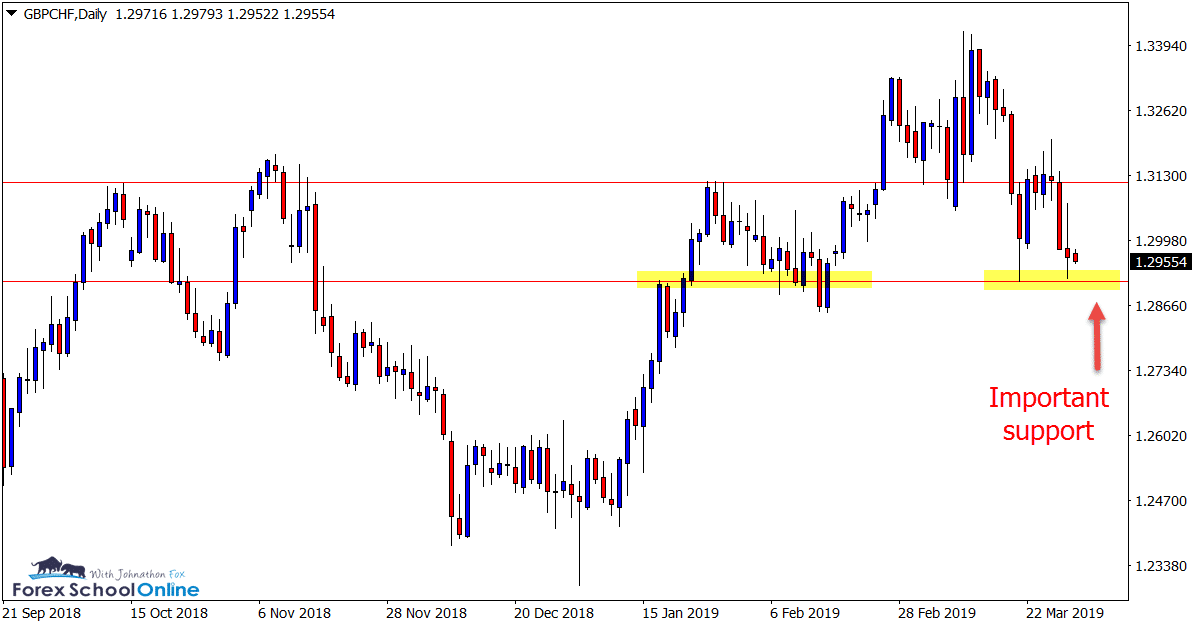
Big Test of Support
Whilst this pair has been making some large movements and candles, overall it has not been going in any particular direction.
Price now finds itself back at the major daily support level looking to make another fresh attempt at breaking lower.
If price can break this level in the coming sessions, then it could pave the way to hunt short trades either through breakouts or quick breakout and re-test trade setups.
Daily Chart
EURCAD Daily and 4 Hour Charts
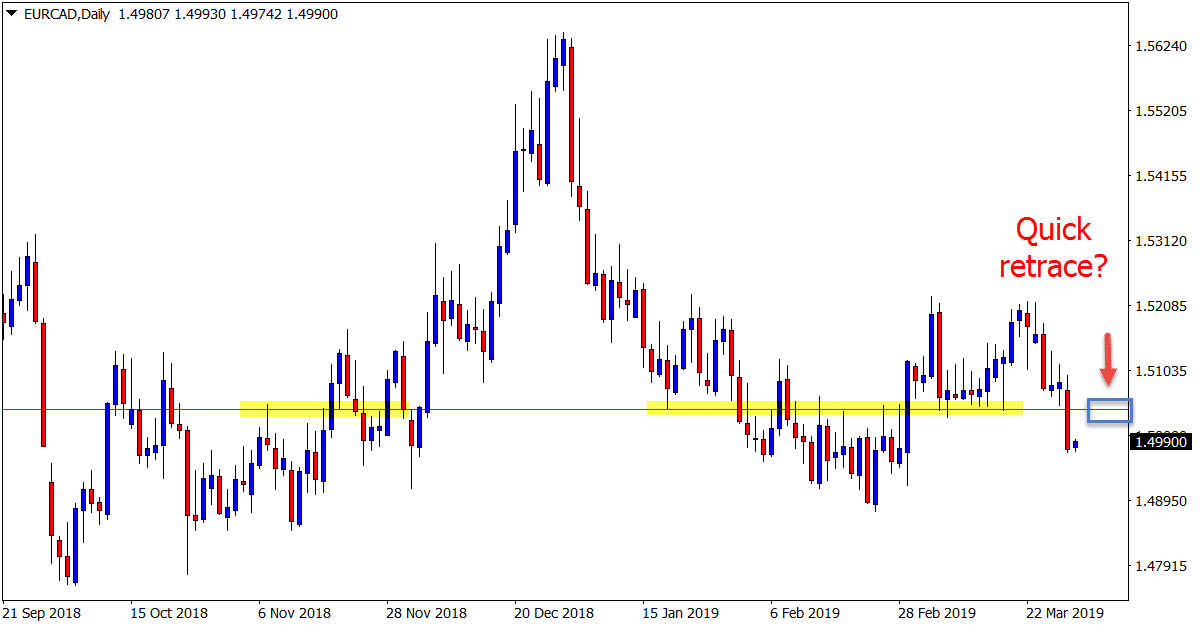
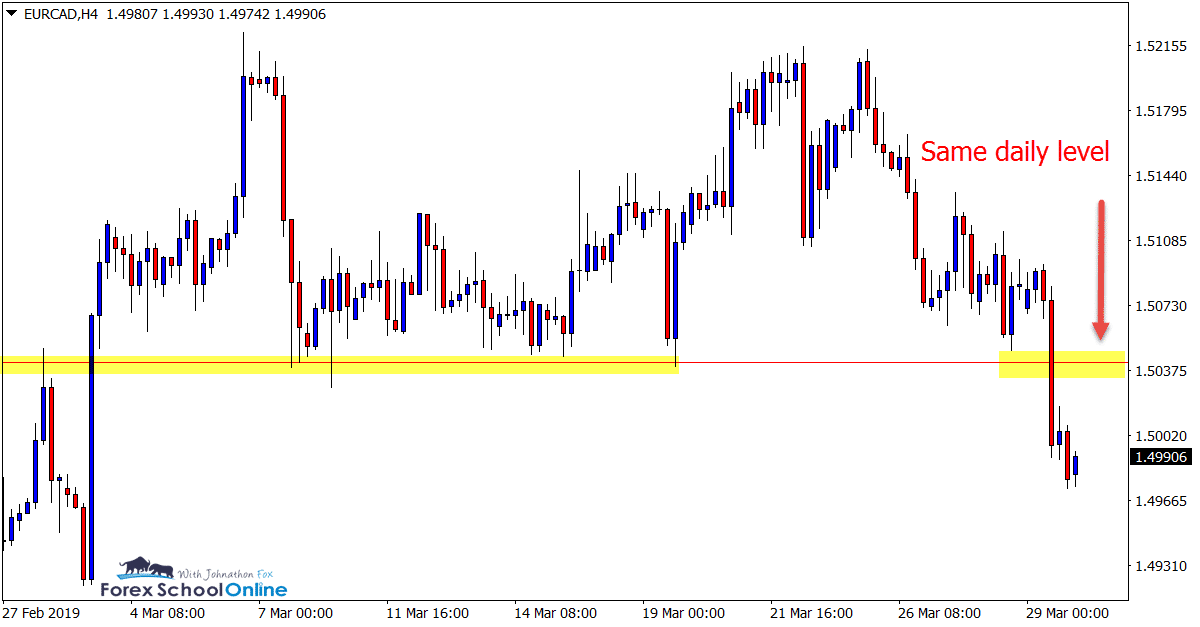
Possible Break and Quick Retrace
Whilst this market presents as fairly choppy in recent times, in the last session we have seen price break a pretty key price flip level that has held in the past as a support and resistance.
This level could now be super interesting to watch over the coming sessions to see if price will rotate back higher and hold as a new price flip once again.
Price could hold as an old support and new resistance and bearish traders could hunt A+ price action reversals on the daily or smaller intraday time frames.
Daily Chart
4 Hour Chart
AUDNZD Daily Charts
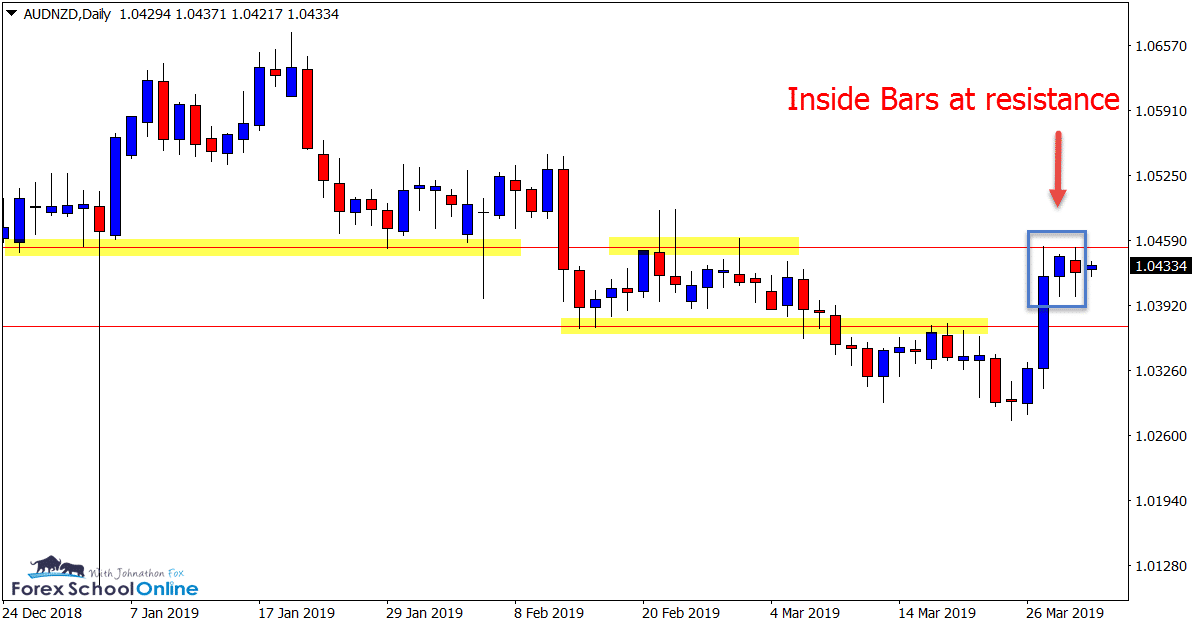
Inside Bars at Resistance
The AUDNZD has now moved into its key daily resistance level and stalled. As the charts show below; the last two candles have formed inside the previous sessions range and are still yet to break the high or low.
This level acted as a previous solid support level when price was making its recent move lower and now price is attempting a reversal back higher it is looking to act as a price flip resistance.
For this new daily market reversal back higher to gain legs, this level and the previous sessions highs will need to be taken out aggressively which could see the level flip and hold again.
Daily Chart
Charts in Focus Note: All views, discussions and posts in the ‘charts in focus’ are the view of Forex School Online and are not recommendations or trading advice. All posts are general in nature and are not advice to buy or sell.
Please leave questions or comments in the comments section below;


👍
Hi Johnathon
Do you only trade the Daily Chart?
Hi Koos,
we trade daily to smaller time frames.
Read and watch following and let me know any questions;
https://www.forexschoolonline.com//trading-daily-chart-price-action-strategies-down-to-intraday/
https://www.forexschoolonline.com//breakout-trading/
Johnathon
nice post jonathan..
I’m interested in finding out if you still run your premium group please…
my email is [email protected]
Good
👍
Your charts are nice and clean man..hope you can show me how to get my targets hit