Weekly Price Action Trade Ideas – 25th Feb to 1st Mar 2019
Markets Discussed: EURUSD, GOLD, GBPCHF and AUDSGD
EURUSD Daily Chart
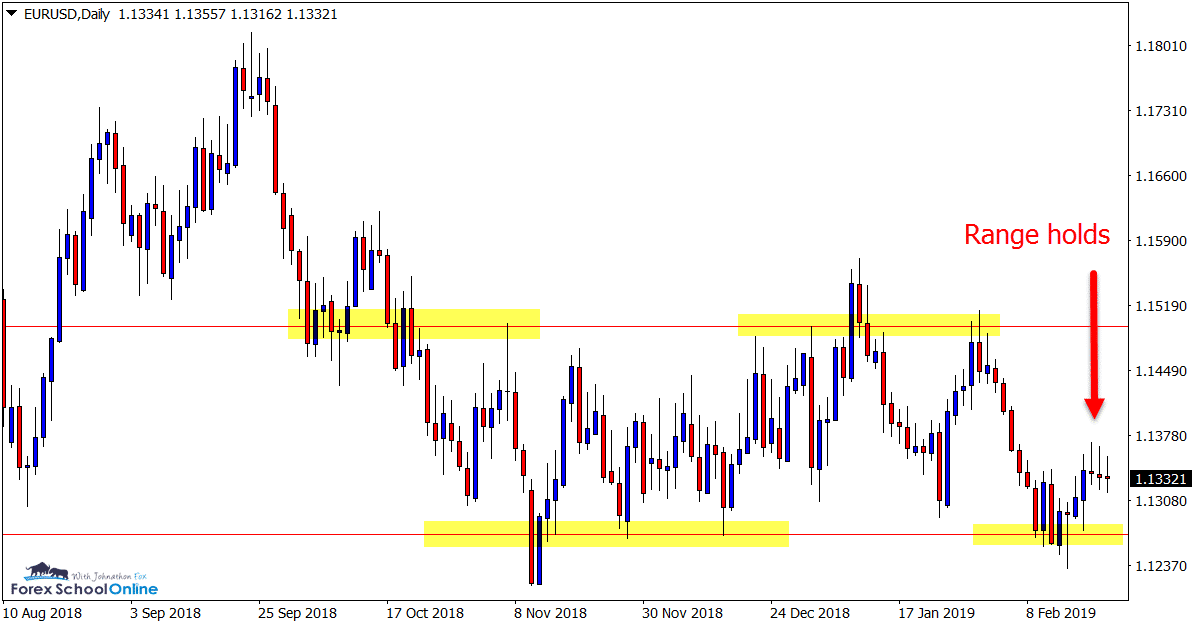
Pin Bar at Range Low – Price Moves Into Mid-way Point
Price action on the daily chart of the Euro has been stuck inside a sideways ranging box for many months.
This week after attempting to breakout and through the lows of the range, price fired off a bullish pin bar and engulfing bar to once again reject the support and move higher.
Until price makes a decisive break of this range, trading anywhere within the middle of the range looks to be incredibly tricky.
This week I released a new video showing how we can look to find and then enter these quick breakout and re-test trade setups that you can watch here; Breakout Trading: How to Find Intraday Trades
Daily Chart
GOLD Daily & 30 Minute Chart
Intraday Price Flip and Pin Bar in Strong Trend
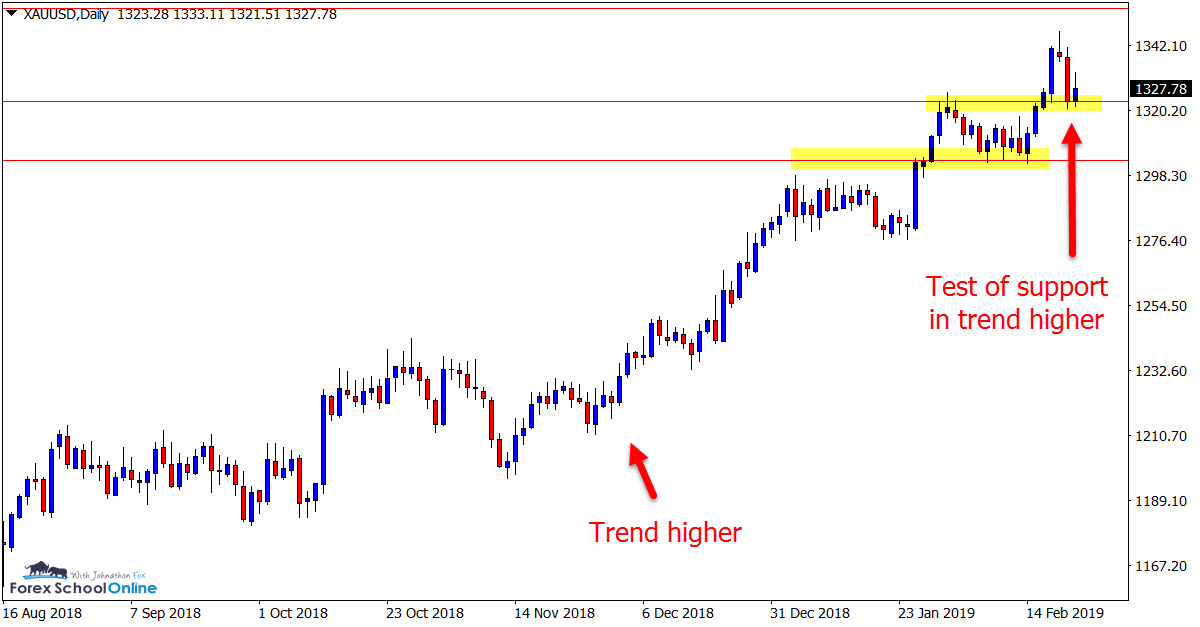
In last week’s trade ideas we discussed this market and the strong trend higher price had been clearly moving in.
Over the past week price has continued this move, making a new high and breaking out of the daily resistance level.
We have now had an intraday test of the old daily resistance and new support, with price forming a pin bar on the 30 minute chart.
After a large move higher off the back of the pin bar, price has since hesitated. This week will be interesting to see if price can gain momentum and move back into the extreme highs that 2018 reached.
Daily Chart
30 Minute Chart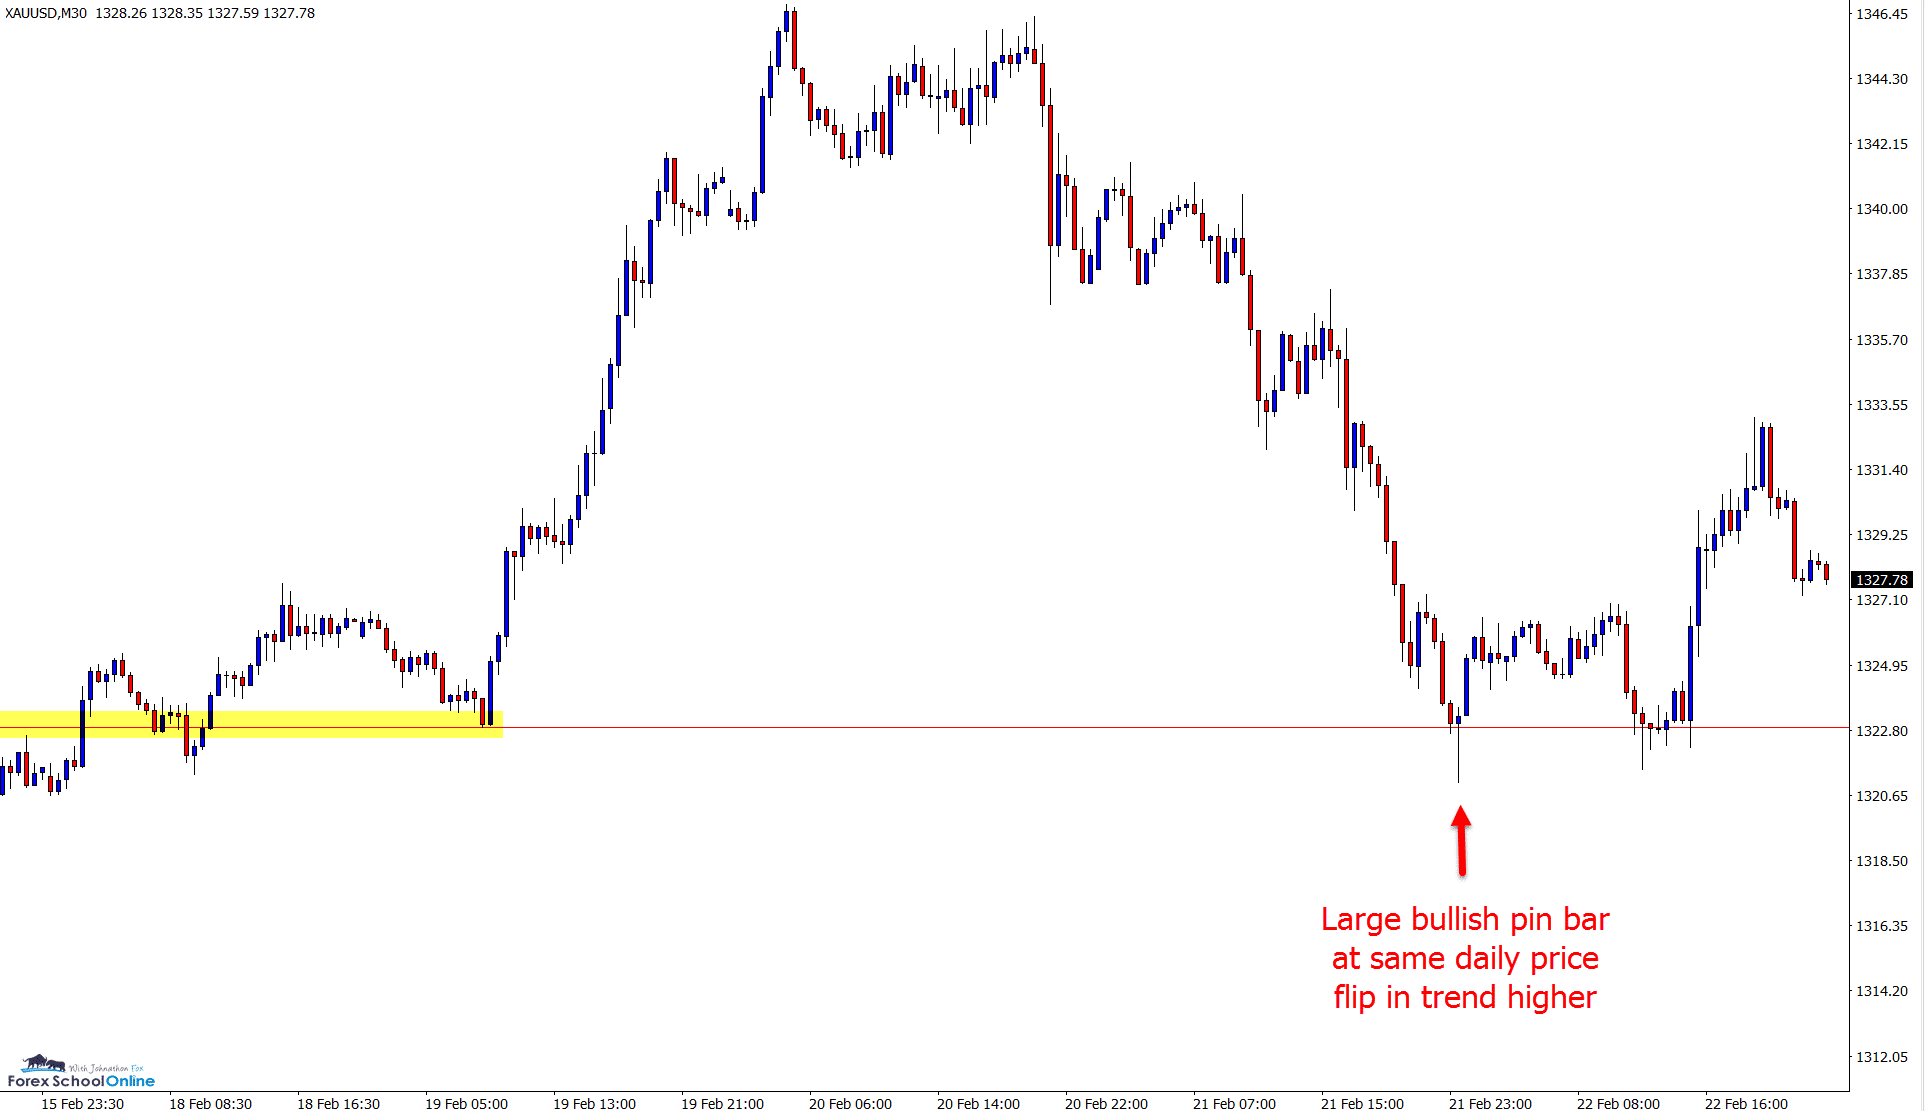
GBPCHF Daily Chart
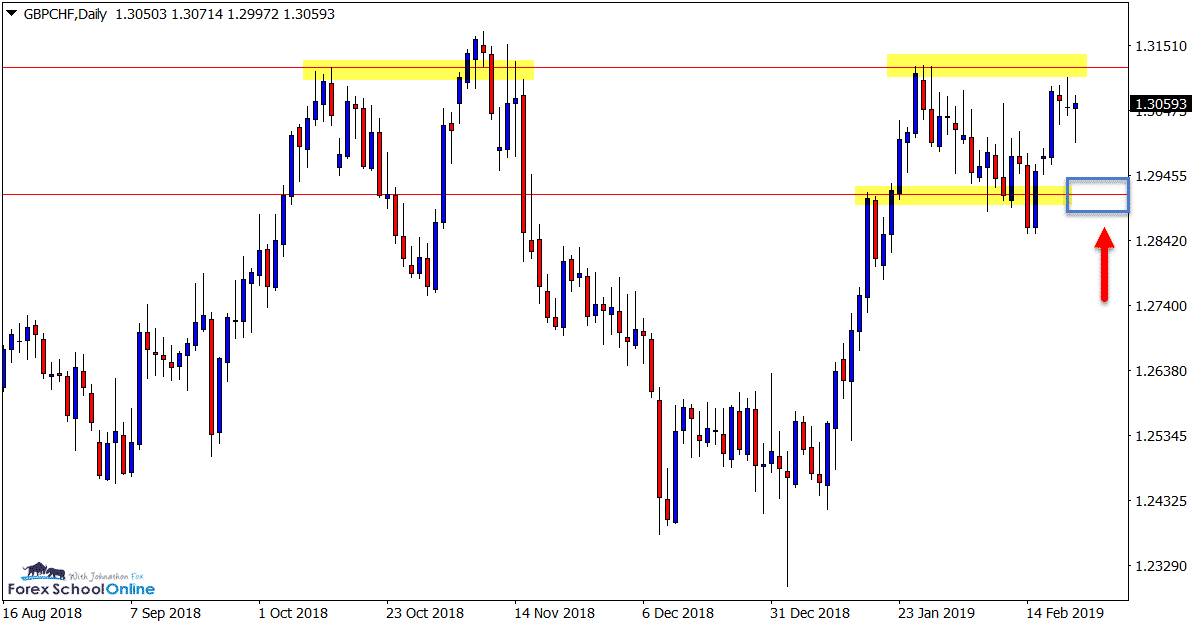
Test of Consolidation Area to Come
Price action on the daily chart of this pair is stuck in a consolidation period after making a recent strong move higher.
After making a solid rejection of the daily resistance level and retracing lower, price is now back at the highs and once again looking to make another test.
A break higher and through this resistance level could open the door for fast breaks and aggressive moves higher, but value traders could also watch the daily support level for price action clues if price makes a rotation lower in the next few sessions.
Daily Chart
AUDSGD Daily & 4 Hour Chart
Daily and Intraday Engulfing Bars
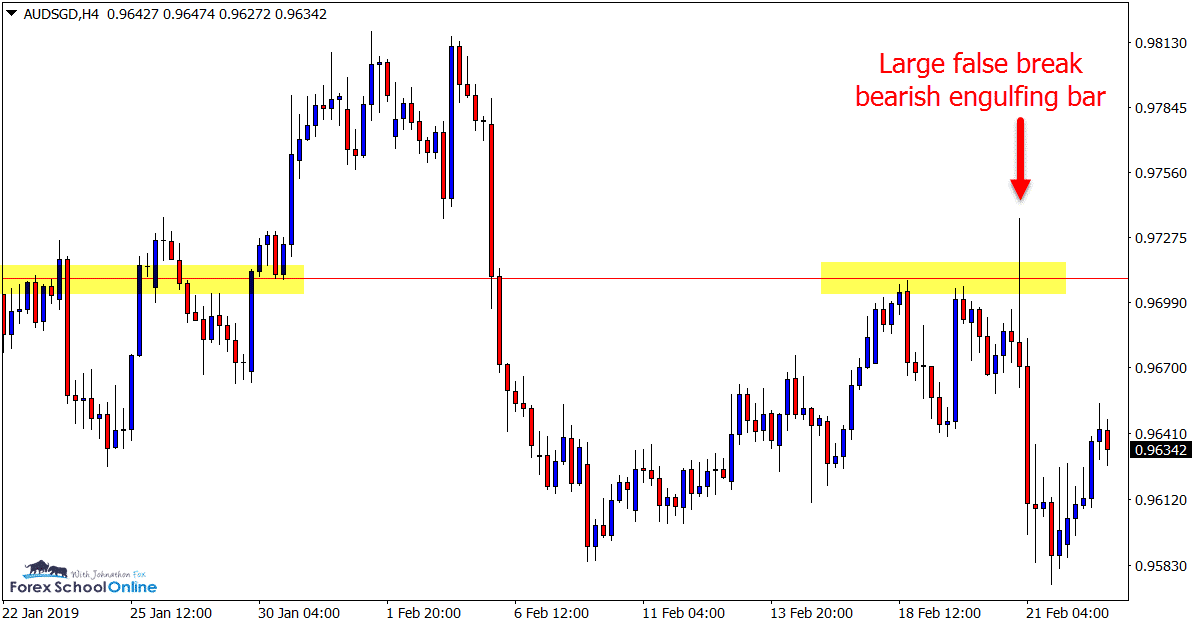
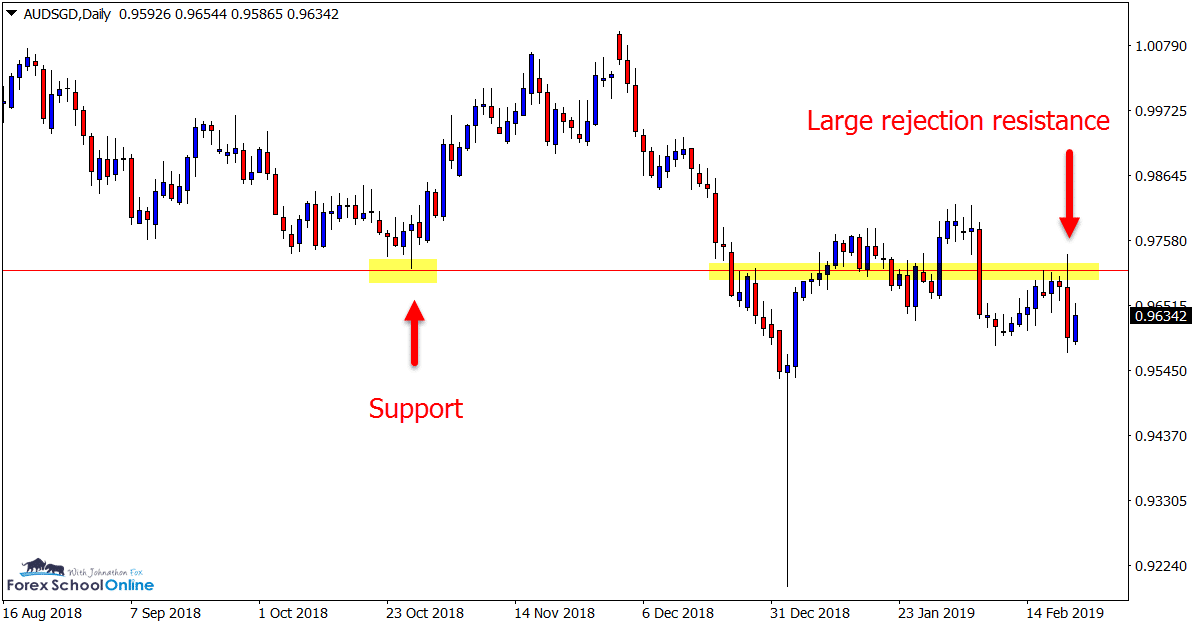
Both the daily and 4 hour chart of the AUDSGD fired off false break Bearish Engulfing Bars = BEEB’s this week.
Whilst both the BEEB’s were at the major daily resistance, the 4 hour charts engulfing bar was a lot cleaner as it was up at a swing high and had a lot more room to move lower.
The daily charts engulfing bar is yet to break lower and is sitting on a recent daily swing low support.
For any move to occur we would need to see the engulfing bar break lower, which would also see the recent daily swing low support broken.
Daily Chart
4 Hour Chart
Note: We Use Correct ‘New York Close 5 Day Charts’ – Download Free New York Close Demo Charts Here
Charts in Focus Note: All views, discussions and posts in the ‘charts in focus’ are the view of Forex School Online and are not recommendations or trading advice. All posts are general in nature and are not advice to buy or sell.
Please leave questions or comments in the comments section below;


Txs Jonathon, It would be nice if you could identify and/or list the numeric levels that you have identified. Txs for doing a great job!!!
Hi Jakob,
I do understand this and why this could be nice. However; I also have to mindful that if I give straight numbers, levels, etc, then a lot of people will copy these directly and not use their own, or learn to use their own.
Safe trading,
Johnathon