Weekly Price Action Trade Ideas – 26th Nov 2018
Markets Discussed Today: AUDUSD, EURAUD, GBPCHF & EURJPY
AUDUSD Daily Chart
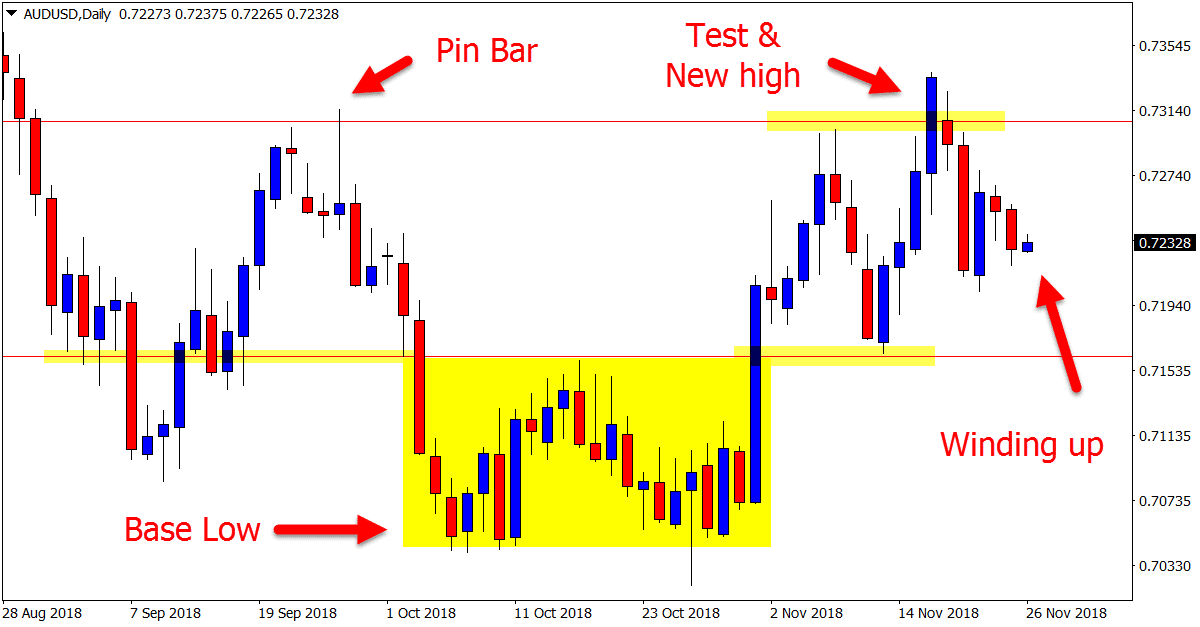
Price Rebounds From Base Low
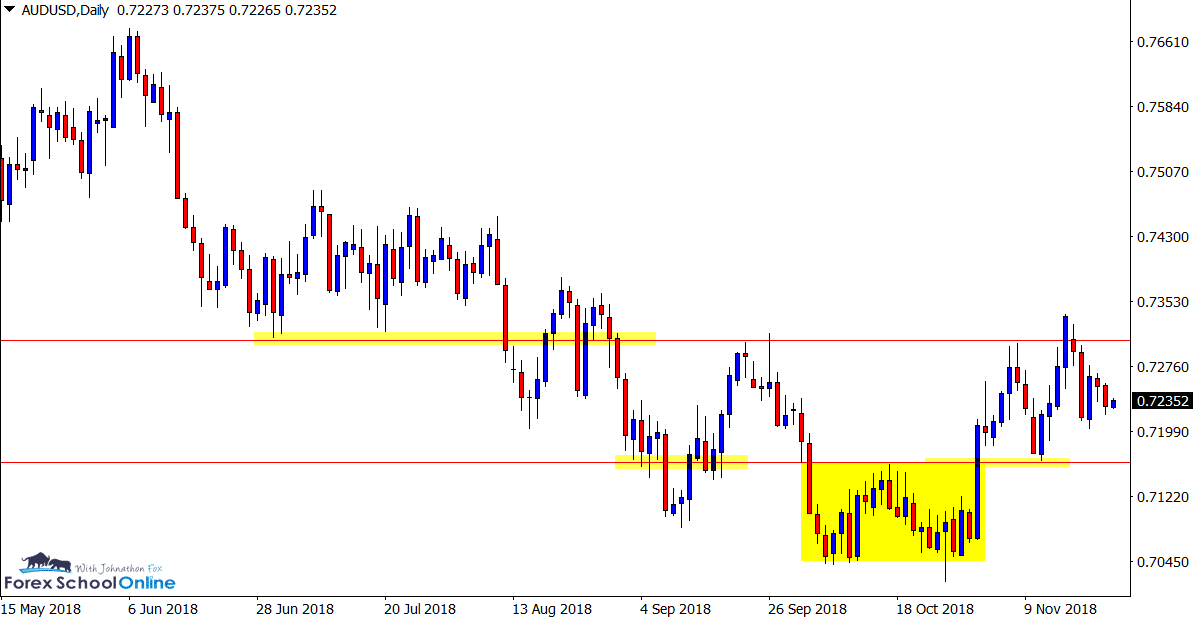
Price on the AUDUSD has been smashed since January this year and since reaching a high of 0.8019, price has been hammered lower.
In the last month however; price has seen this sell-off stall, at least for the time being.
We have seen some solid pull-backs in this move lower allowing traders to sell short and once again get into the move lower.
What we have not seen is an extended base low, where price finds support, followed by a break higher and price holding as a new support.
In the last two weeks we can see that price broke higher, moved to go lower and held as a new support and old resistance forming a daily chart 2 bar reversal.
We can also see price did not breakout of the resistance overhead, but formed a new high. Price is now winding up and a new test of the overhead resistance could be very interesting to watch for price action traders.
Daily Chart
Daily Chart
EURJPY Daily Chart
Potential Breakout
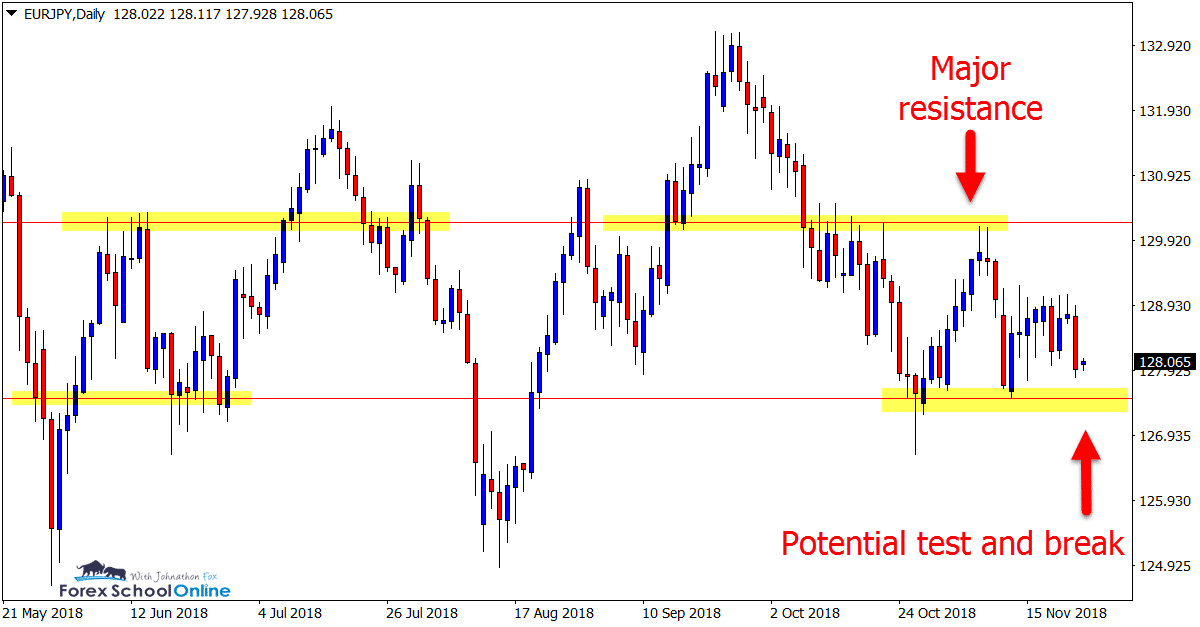
We can see in this market that price has been trading in a fairly clear sideways ranging pattern in recent times.
The lows and highs of this range are not exact, but are pretty solid for a market that has been moving sideways most of this year.
If price can continue the move into the near support, then we could see a potential breakout and a host of trading opportunities such as breakouts or quick intraday breakout and re-test trade setups.
Daily Chart
GBPCHF Daily Chart
Bullish Engulfing Bar at Support
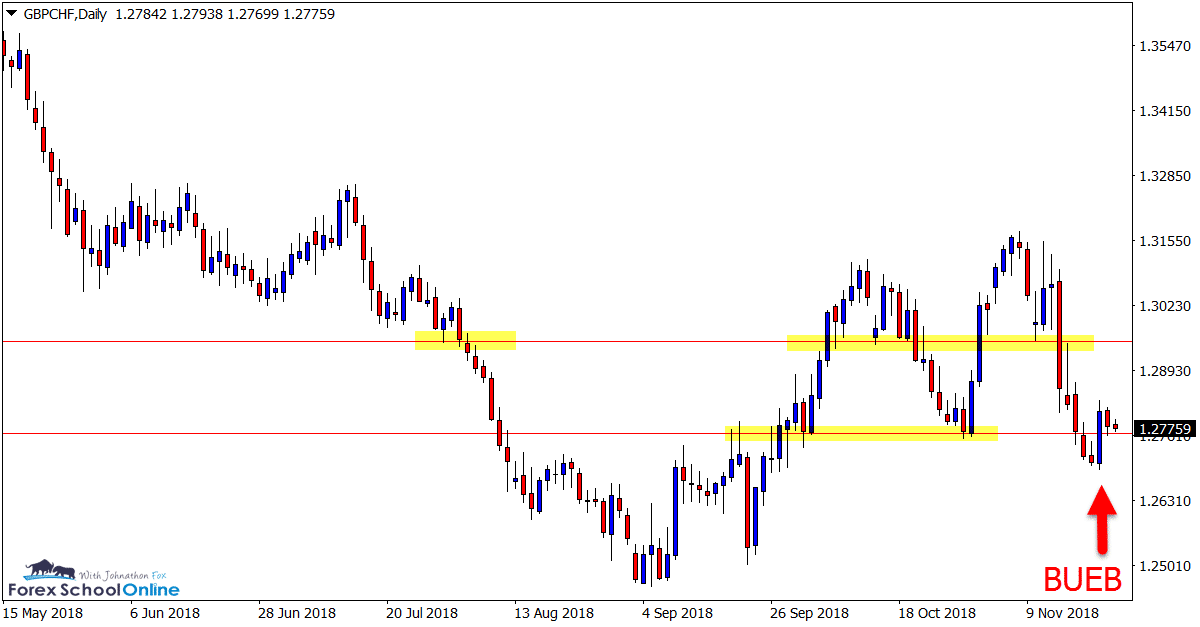
As the chart below shows for this pair; price has fired off a Bullish Engulfing Bar = BUEB at a major support level engulfing the previous two candles.
Whilst there is a minor level overhead around 1.2860, if price can break higher and gain momentum, then it could push into the overhead resistance around 1.2950.
A break lower and we could look for the support to hold as a new resistance.
Daily Chart
EURAUD Daily Chart
Engulfing Bar at Resistance
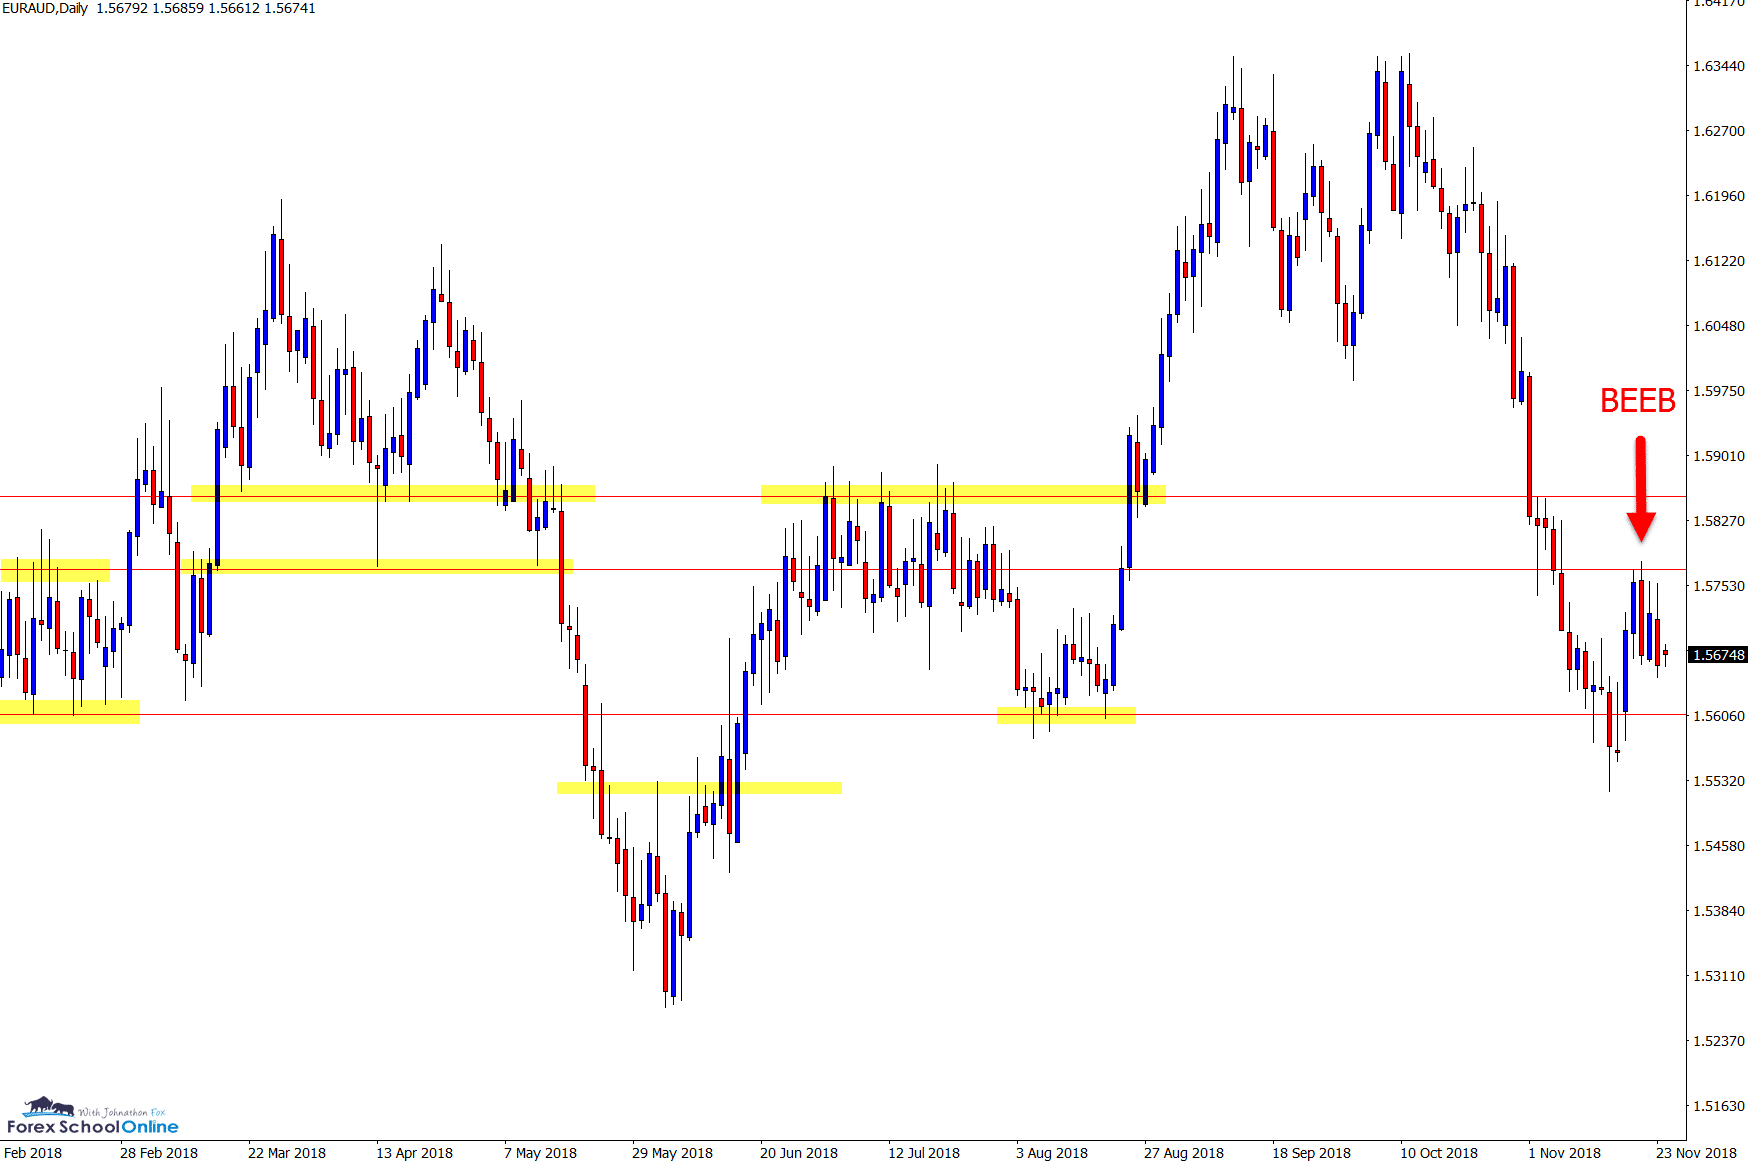
After forming a double top on the daily chart at the major highs, price has sold off lower super aggressively in recent times.
Price has since pulled back into the overhead resistance and formed a Bearish Engulfing Bar = BEEB.
Price is not far-off the support level it has only just recently bounced higher from.
To see another serious push lower we would need to see price take out these lows.
Daily Chart
Note: We Use Correct ‘New York Close 5 Day Charts’ – Download Free New York Close Demo Charts Here
Charts in Focus Note: All views, discussions and posts in the ‘charts in focus’ are the view of Forex School Online and are not recommendations or trading advice. All posts are general in nature and are not advice to buy or sell.
Please leave questions or comments in the comments section below;


Leave a Reply