Weekly Price Action Trade Ideas – 12th Nov
Markets Discussed Today: EURUSD, EURCAD, GOLD v USD and AUS200.
EURUSD Daily & 4 Hour Chart
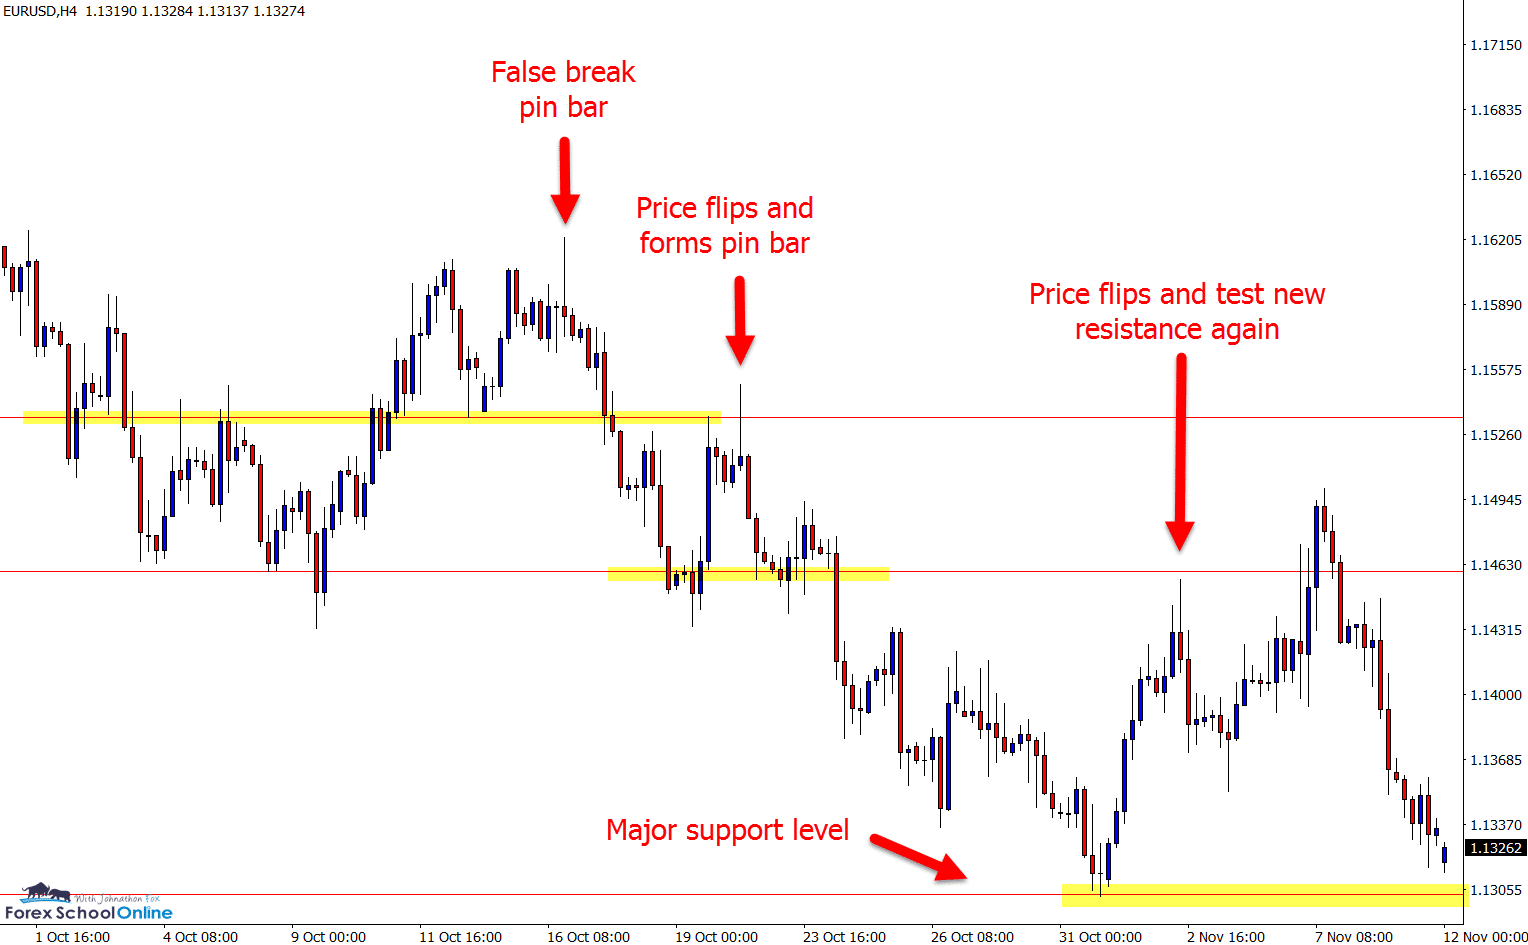
Price on the EURUSD has opened the week looking to test the major daily support level.
As we discussed in our last charts in focus looking at the EURUSD, this pair has been in a sideways ranging market forming some solid signals.
After forming the false break pin bar at the swing high, price broke lower before once again forming a bearish pin bar to continue the move.
Price is now down at the major support where it could find support. This looks to be a super important level to watch the price action clues over the coming sessions.
Video: How to Trade the False Break From Price Flips
Daily Chart
4 Hour Chart
EURCAD Daily Chart
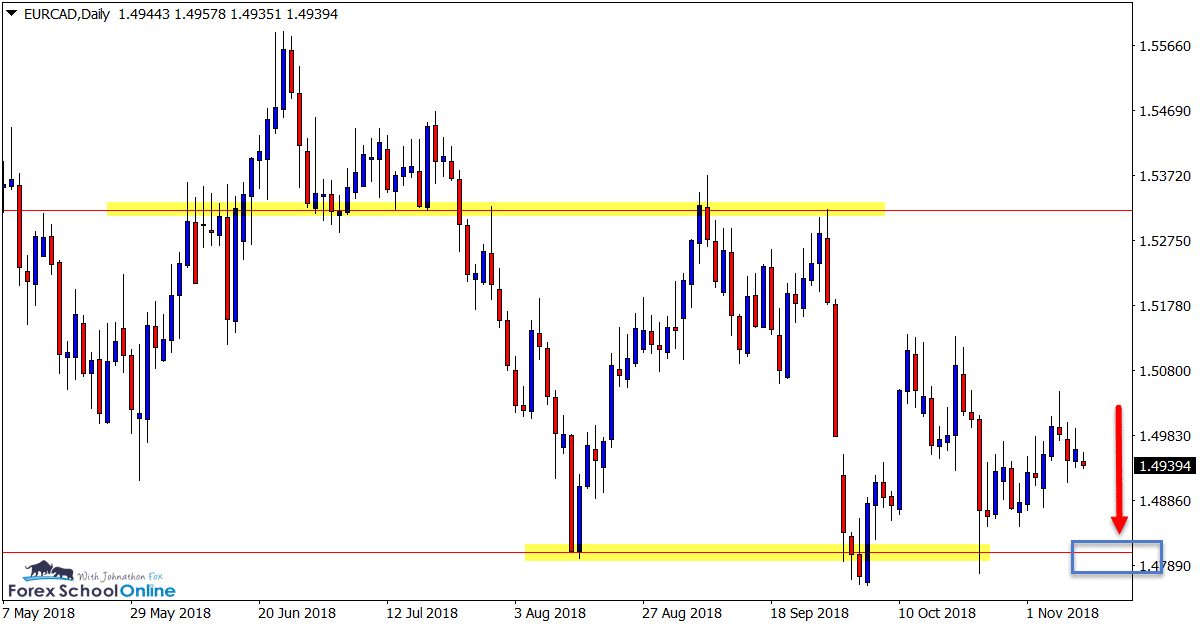
Price on the EURCAD is stuck in a box / range with price now winding up and compressing.
Trading within these ranges is extremely difficult and risky and the higher probability play is to watch the major highs and lows the range has already created.
The longer price winds up and stays within a tight range, often the more explosive the breakout will be. If we can see price break lower, it could open a lot of trading opportunities such as breakouts or breakout and re-test trade setups.
Learn How to Play the Breakout & Re-test Strategy
Daily Chart
GOLD Daily & 1 Hour Charts
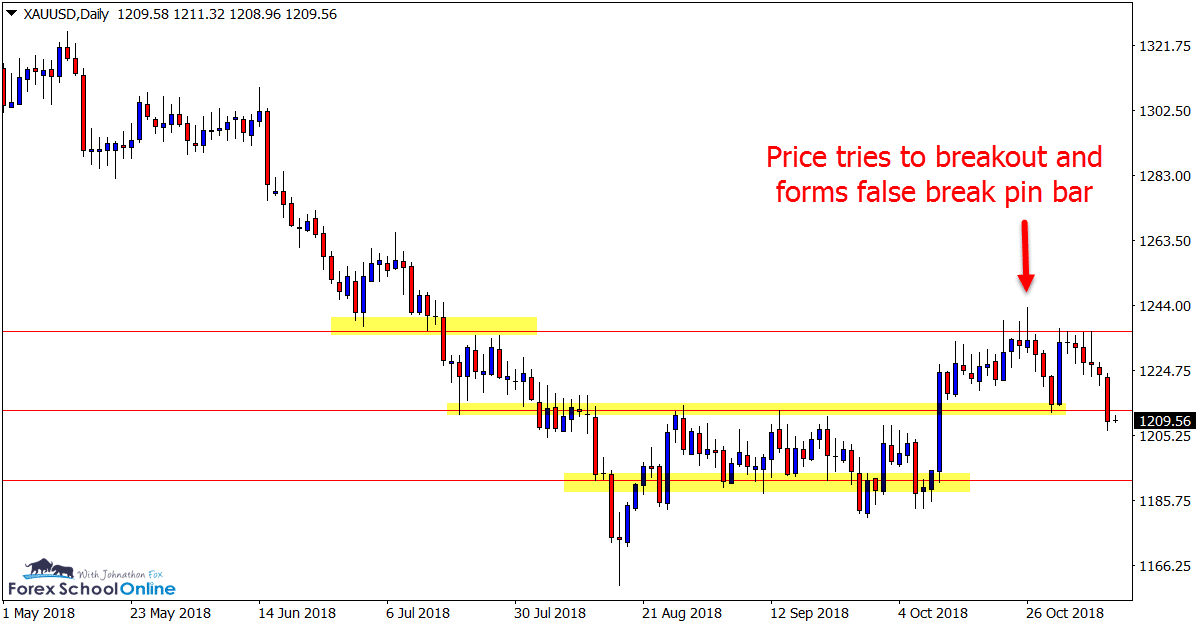
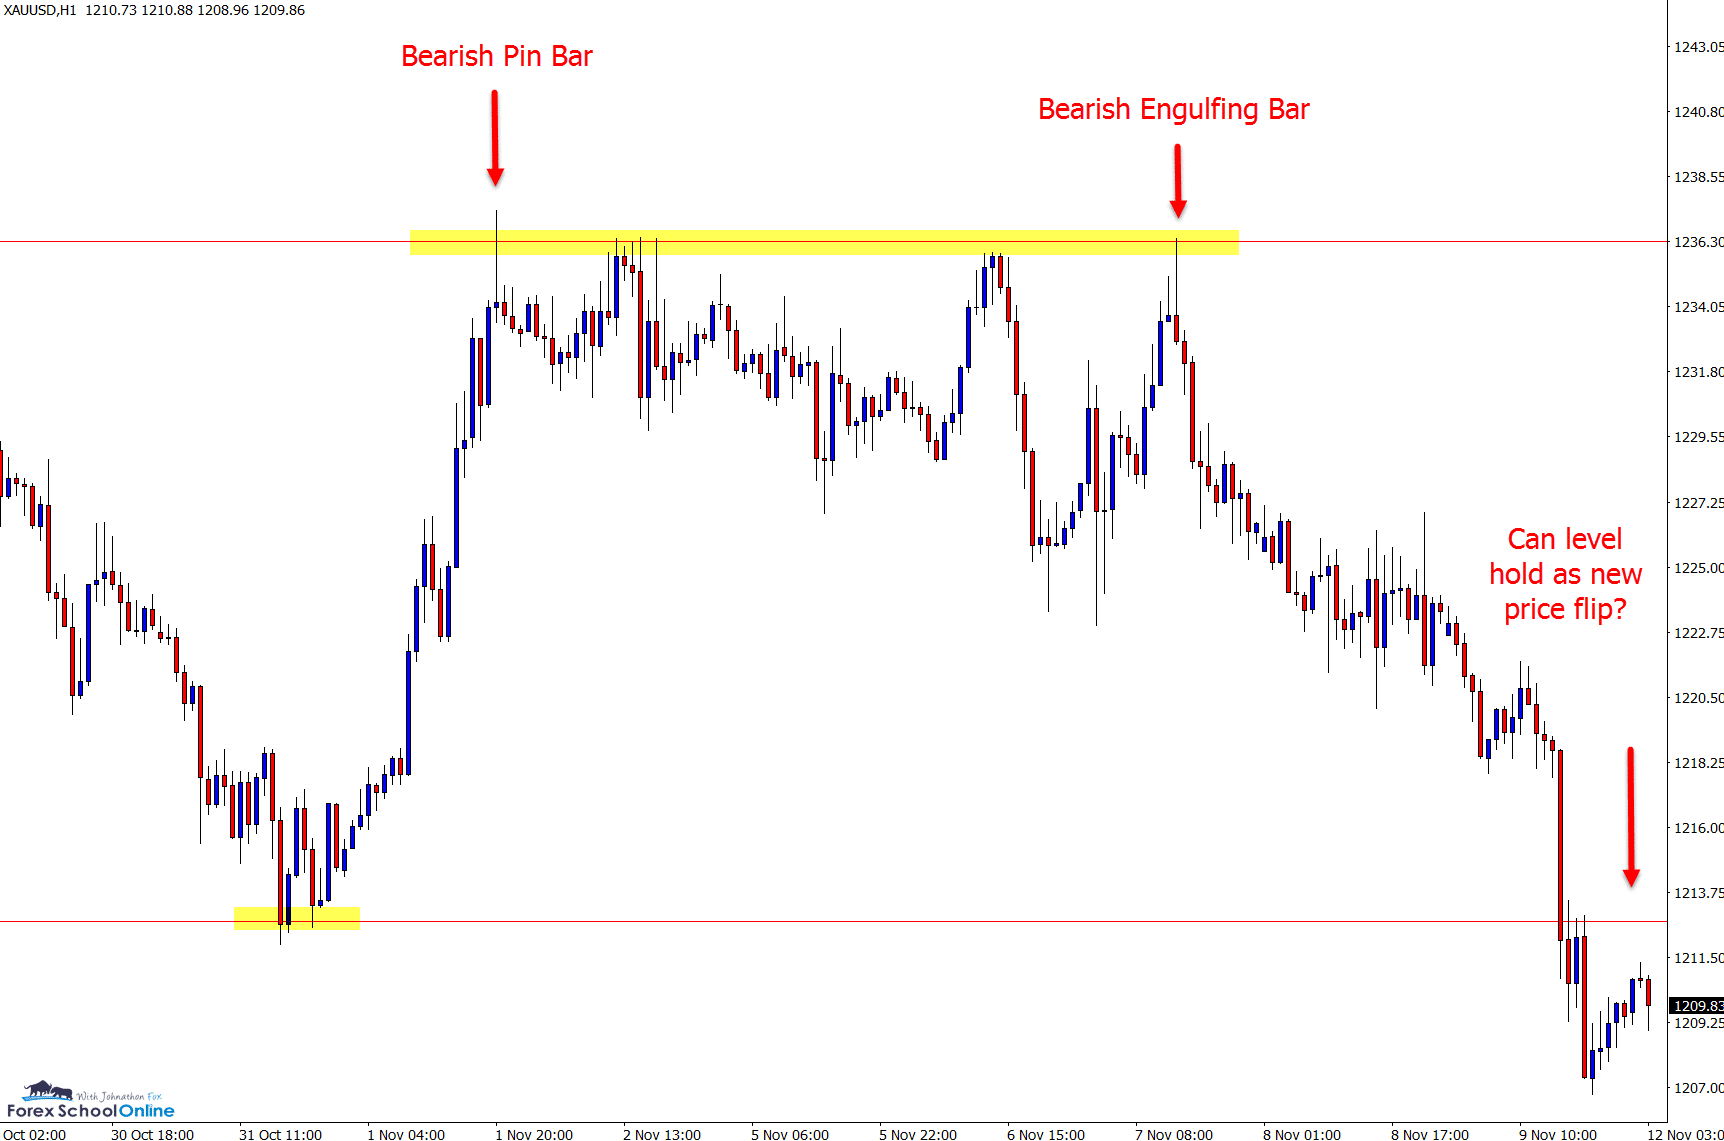
After breaking out of the super tight congestion price was stuck in, price made a breakout higher.
After reaching the overhead resistance, price formed a false break bearish pin bar and has since reversed back lower to now be back under the support and within the old congestion area.
This support / price flip level looks to be crucial. If price holds below, then we could see price move back into the lows of the congestion. However; a break above and the move higher could build momentum.
Daily Chart
1 Hour Chart
AUS200 Daily & 4 Hour Charts
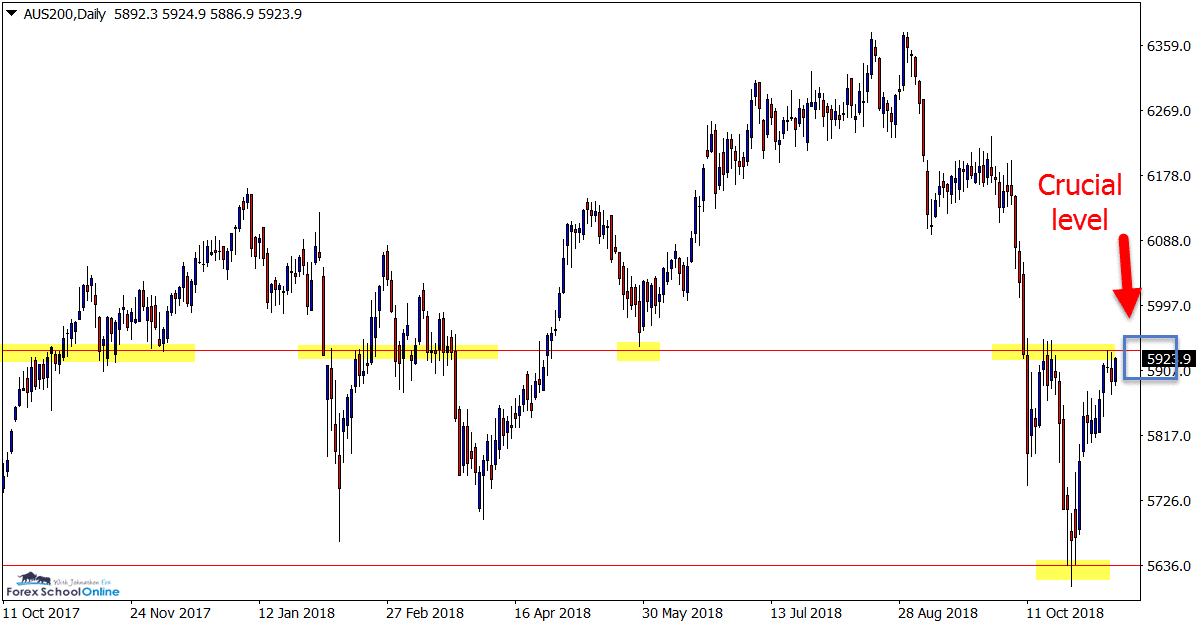
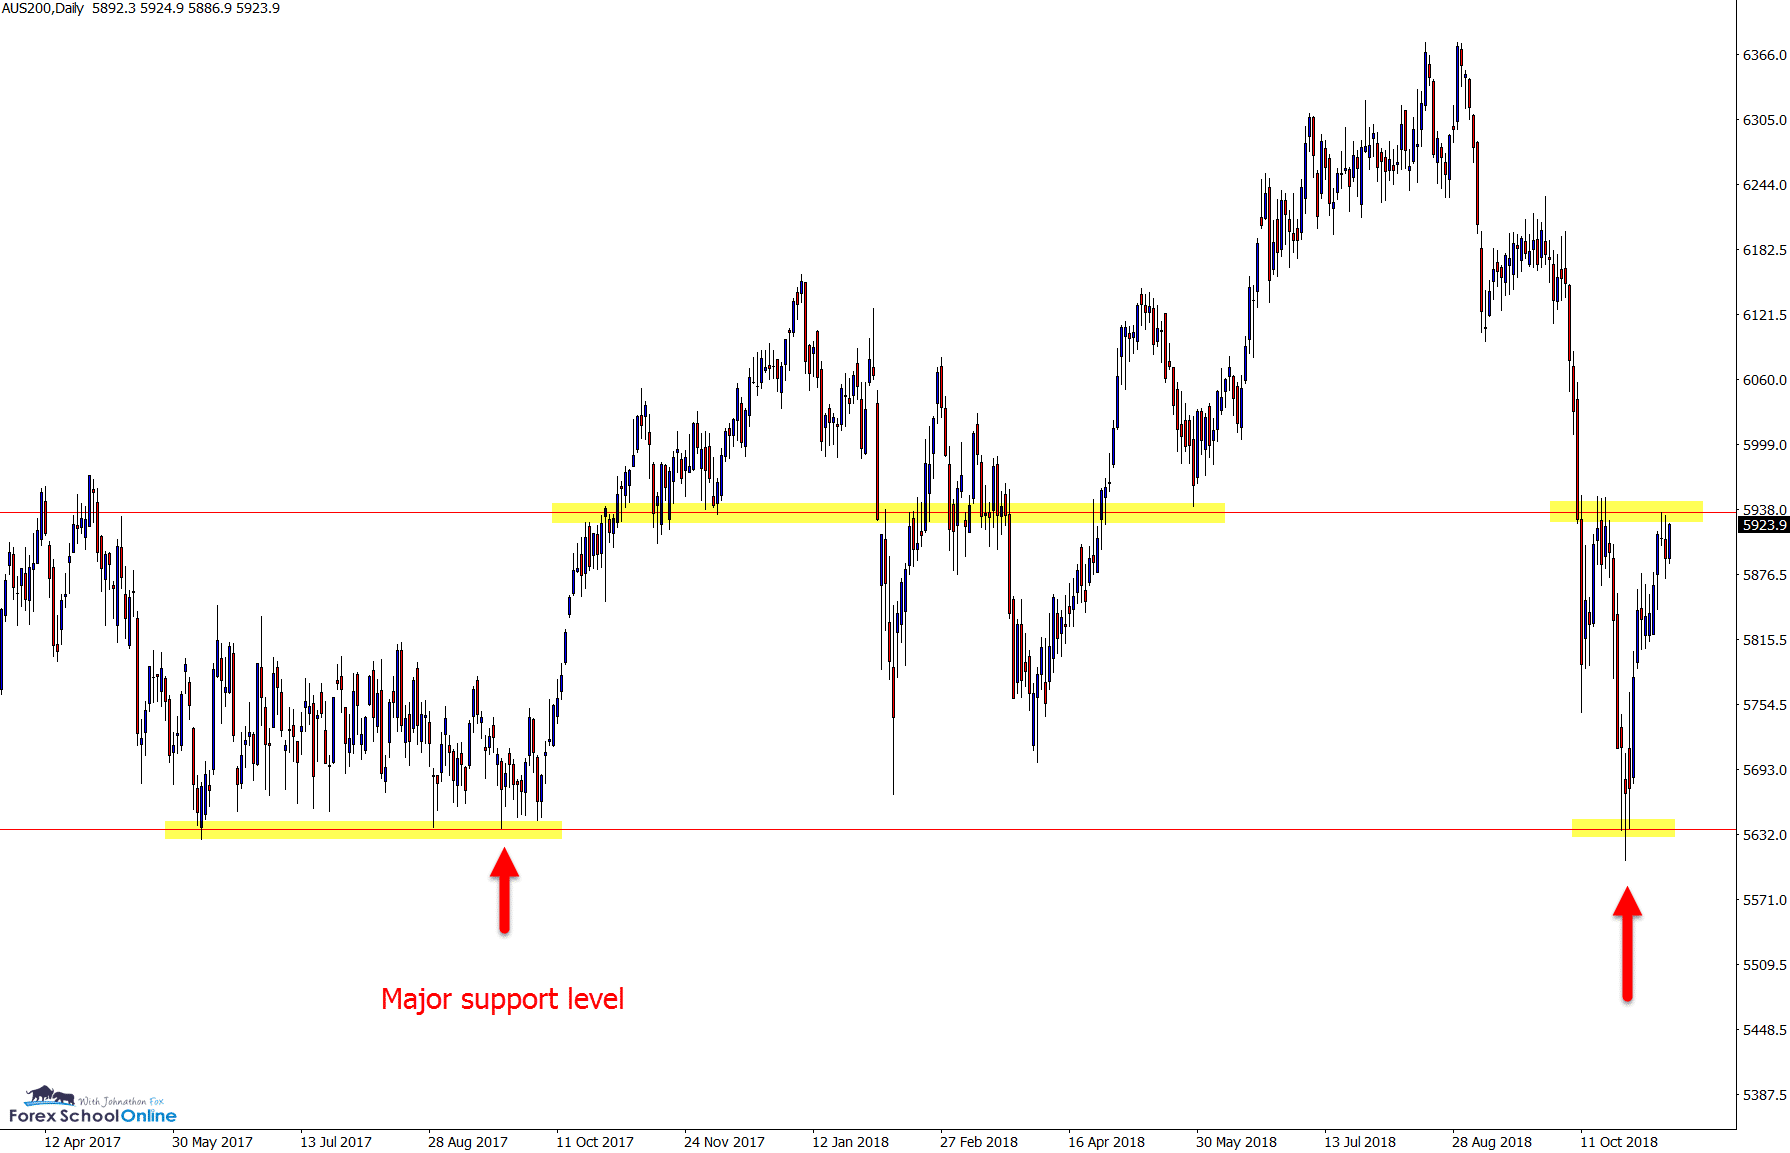
This is a super interesting chart where we can see price has recently sold off incredibly aggressively only to be stopped by the multi-year support level.
This was a crucial support level for this market because price had tested it on many occasions, but had not been below it since 2016.
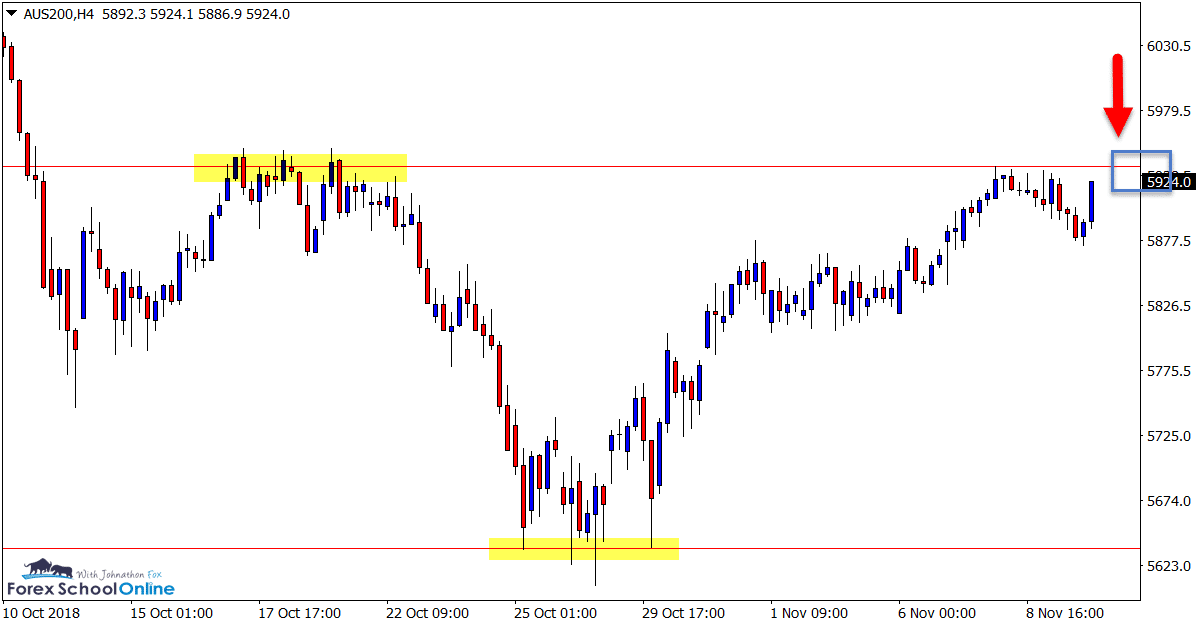
Price has since rocketed back higher and found itself back at the resistance level, now making a major test. Whilst the move higher has been strong, this level is solid and bearish signals here could open the way for a pull-back lower.
If price does break and continue with the move higher, then there is a lot of space to move into and the market could turn very bullish again.
Daily Chart – Zoomed Out
Daily Chart
4 Hour Chart
Note: We Use Correct ‘New York Close 5 Day Charts’ – Download Free New York Close Demo Charts Here
Charts in Focus Note: All views, discussions and posts in the ‘charts in focus’ are the view of Forex School Online and are not recommendations or trading advice. All posts are general in nature and are not advice to buy or sell.
Please leave questions or comments in the comments section below;



It seemed eurusd will move lower in the future. What you think about possible head and shoulders pattern on the weekly chart?
Hi Roy,
yes, the level it is now testing looks super important. It is a many year level and also Very Big Round Number 1.3000. What price does around this level looks to be crucial.
I do not use the head and shoulders. This is not right/wrong, just not something I employ.
Safe trading,
Johnathon
Thank you Jonathon!
I was watching EUR/USD as well as Gold so It’s reassuring to have you see this as well!
Thanks again for taking time out to do this for us.
Hi Bob,
glad you enjoy them.
We can see price has now strongly broken the Euro level and stayed below the Gold level, discussed moving lower.
Safe trading,
Johnathon