Weekly Price Action Trade Ideas – Sep 10th
Note: We Use Correct ‘New York Close 5 Day Charts’ – Download Free New York Close Charts Here
EURUSD Daily Chart
Price Action Stuck in Sideways Range / Box
It is just as important for traders to analyse the markets that are stuck or ranging as it is to analyse the potential trades or where price is looking to move back into major areas of interest.
Price in recent times on the EURUSD daily chart has become a little stuck, trading sideways and moving into a boxing area.
It is crucial that we recognise the different market types because they hold the key to how price is looking to potentially move.
When price is stuck in a tight box and sideways pattern there are more minor support and resistance areas and price moves a lot less freely increasing the chance of whipsaw and bouncing around.
We can see on the EURUSD daily chart that it has a fairly clear high and low. These can open a lot of trading opportunities for either false breaks at the high or low or breakout and quick re-tests of the old support / resistance areas.

OIL v USD Daily Chart
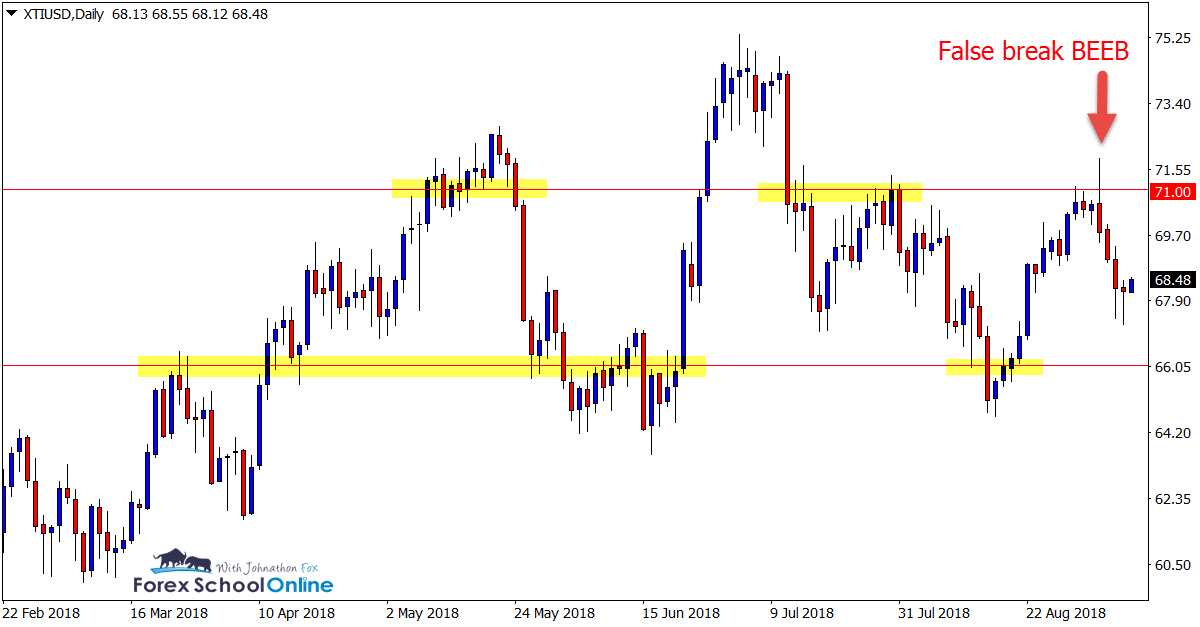
Price Fires Off False Break Engulfing Bar
The Oil market was in a very similar situation to what the EURUSD is in now, moving in a sideways range pattern.
After price had been moving solidly higher over the past few months, price has now paused, consolidated and begun to range.
At the major resistance of this range price moved up to make a test to breakout and formed a false break bearish engulfing bar faking those traders looking to go long and snapping back lower to move once again back lower into the range area.

EURAUD Daily Chart
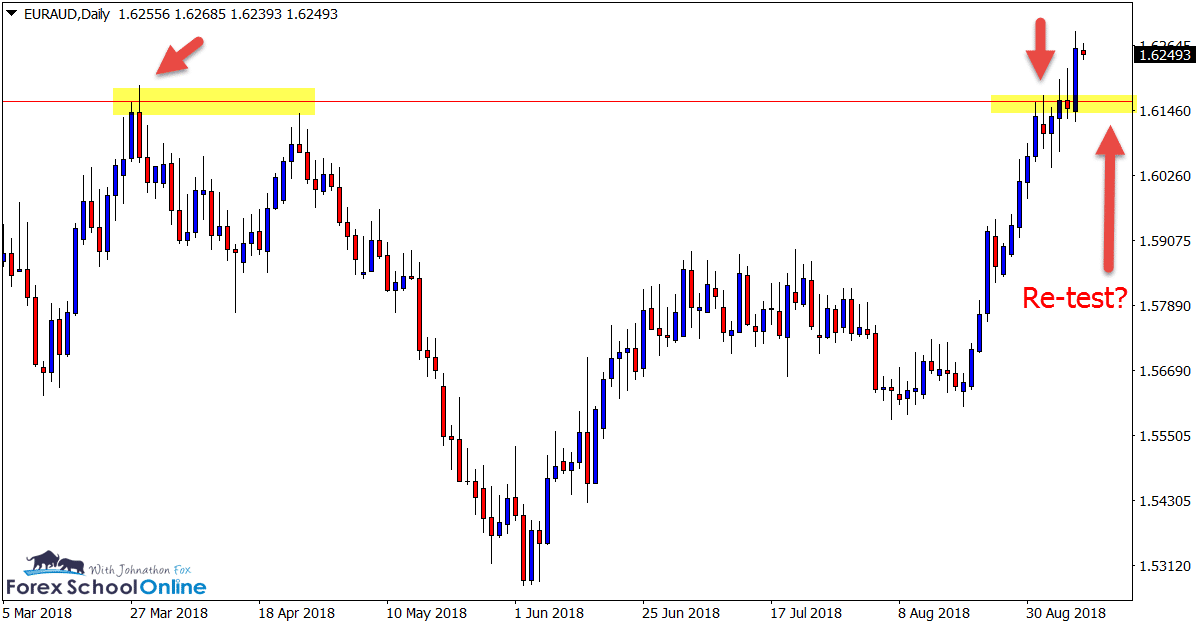
Trend and Breakout Higher
We discussed the EURAUD last week and you can read that post in the ‘Charts in Focus 4th Sep‘. In that summary we looked at how price was moving into the major resistance and potentially looking to make a breakout.
Price had been moving very strongly higher in recent times and now we can see that price has broken out strongly, closing outside the major resistance area.
If price can now make a quick retrace back lower, we could potentially see a re-test of this new support and bullish triggers to continue long.

NZDJPY & NZDUSD Daily Charts
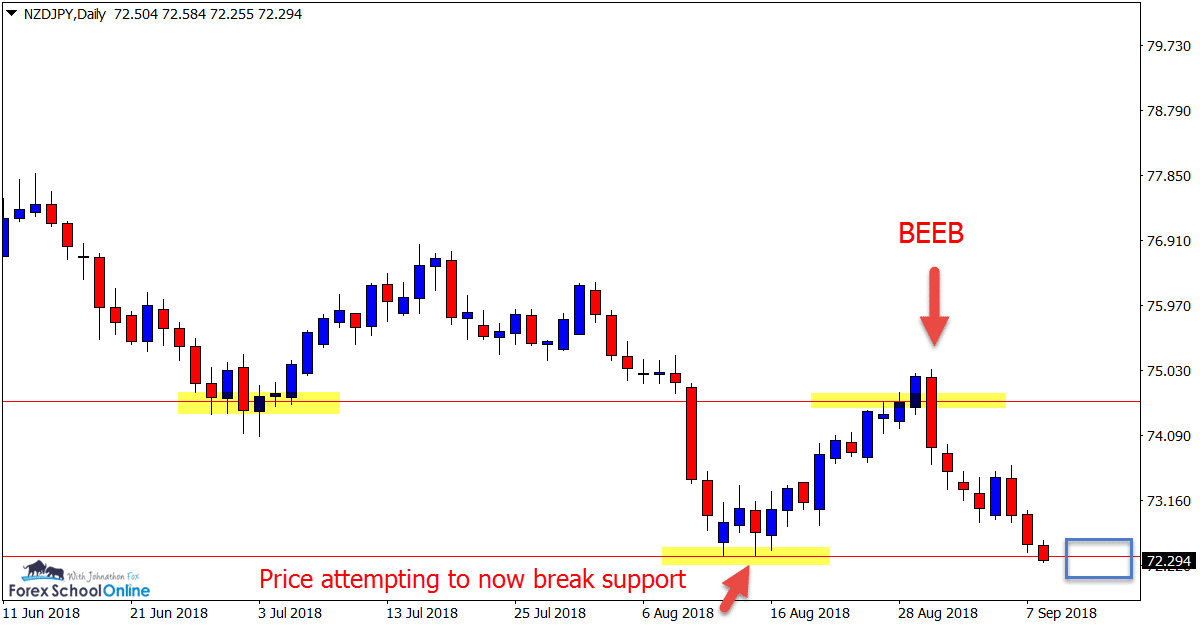
Engulfing Bar Continues Lower And Now Looking to Break
After discussing last week how price had formed a major BEEB and was looking to move lower into the next support, we can see that price is now attempting to break this major daily level.
This level could prove crucial because if it can break it could open the way for more selling lower and potential short trades like we discuss in the lesson first test of support or resistance strategy.
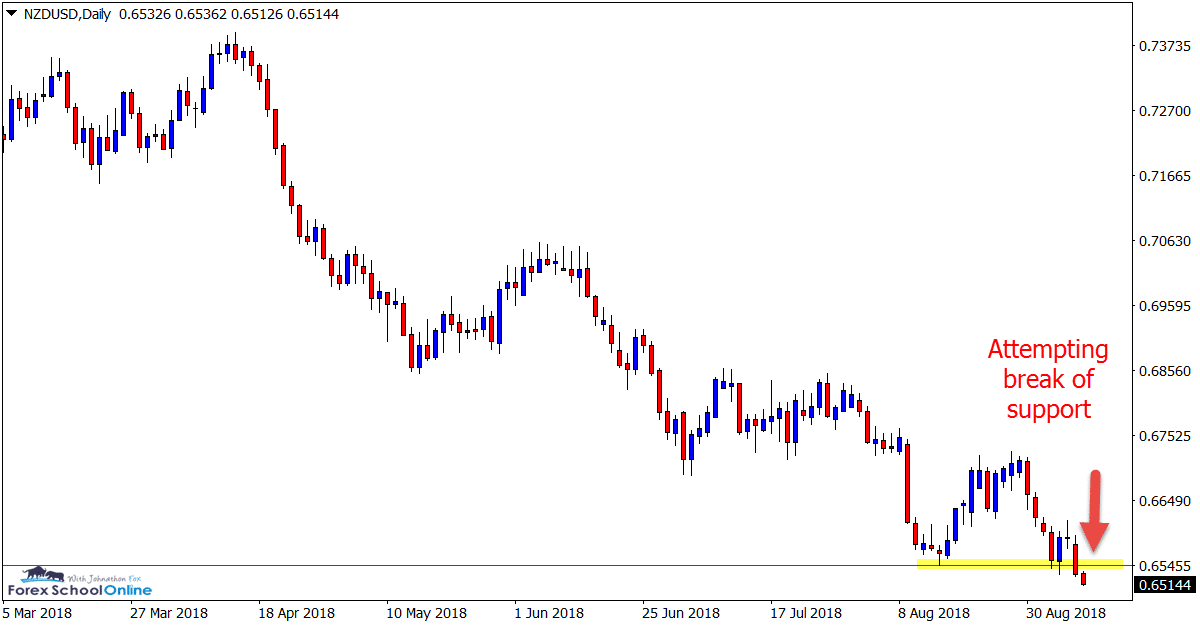
This is a similar looking market the NZDUSD that is also looking to break lower and through its major support level on the daily price action chart.


Charts in Focus Note: All views, discussions and posts in the ‘charts in focus’ are the view of Forex School Online and are not recommendations or trading advice. All posts are general in nature and are not advice to buy or sell.


Hi Jonathon,
thank you very much for taking time out of your busy schedule to give us your weekly analysis! Always get excited when I see an email from you…I’m like a little kid in a Candy Shop. lol
Hope you have a great trading week and also that your family is doing well!
You too Bob!
Johnathon