Price is making some super interesting moves just as I write this for you on the NZD Forex crosses.
Earlier in the week it was the GBP pairs as you will be able to see on your charts and now it is the NZD pairs as I am about to go through for you below with the NZDCAD and NZDUSD.
NZDUSD Major Breakout After 2 Bar Reversal
I have been watching the NZDUSD in particular super closely for a while now.
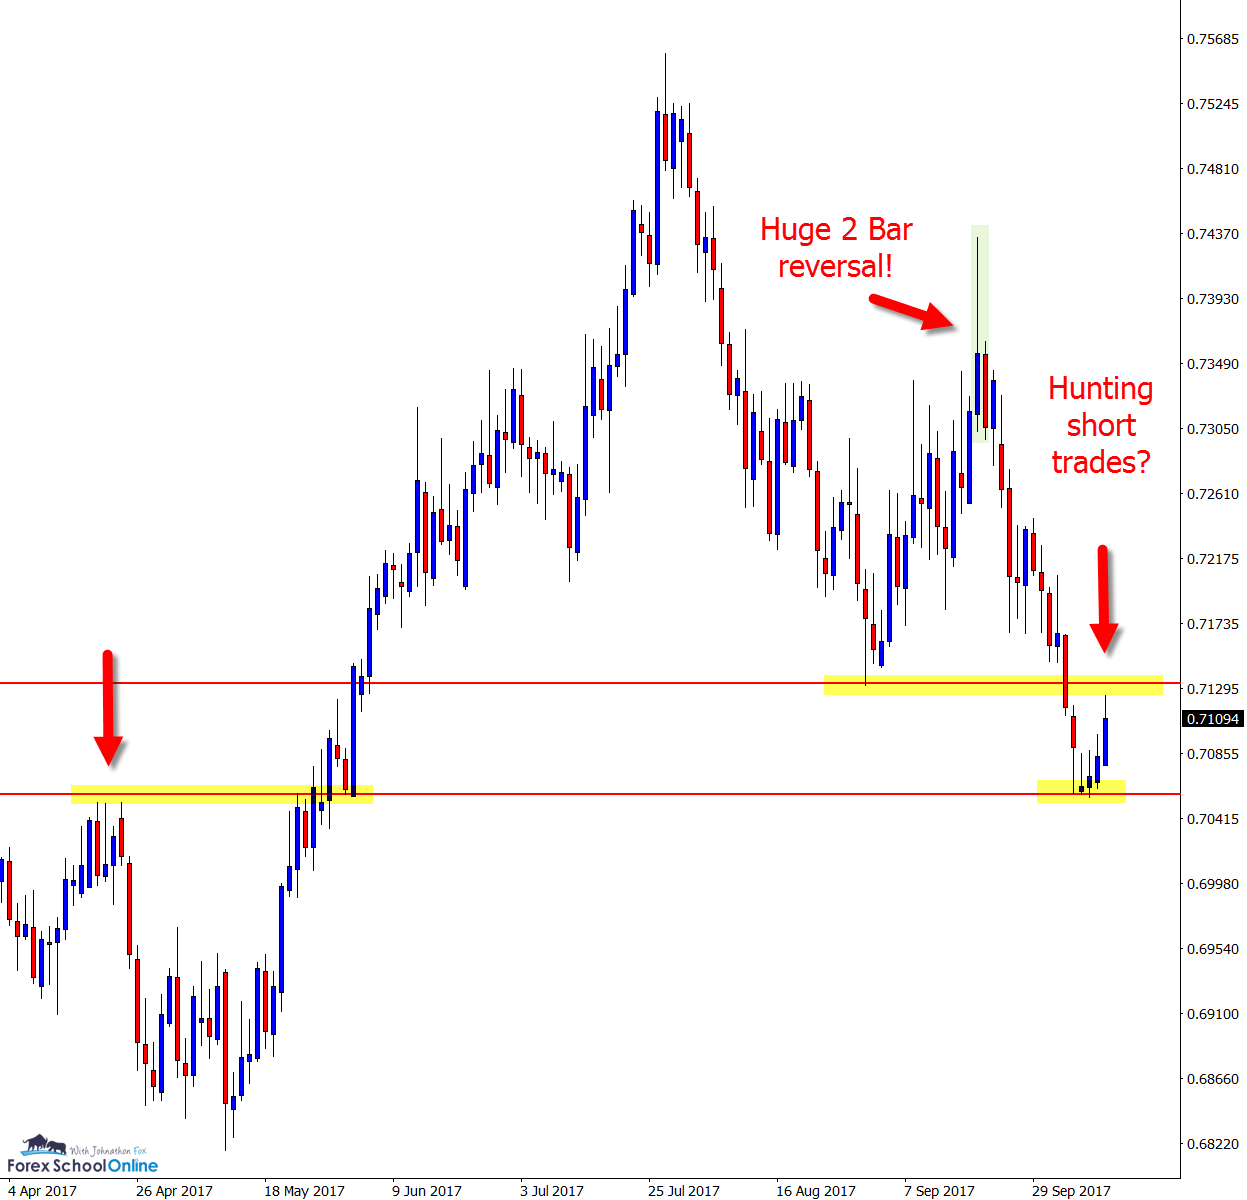
Whilst there is no clear trend to make a trade inline with, what you will notice and I have highlighted in the chart below for you is that after price formed the huge 2 bar reversal; price made a super obvious and strong breakout of the major level lower.
Since then price has broken out of the consolidation and into space to freedom and I have been looking for any quick pull-back to get short to continue with the breakout and especially a short trade from the major breakout old support / new resistance price flip area.
NZDUSD Daily Chart

NZDCAD Sitting at Price Flip Decision Level
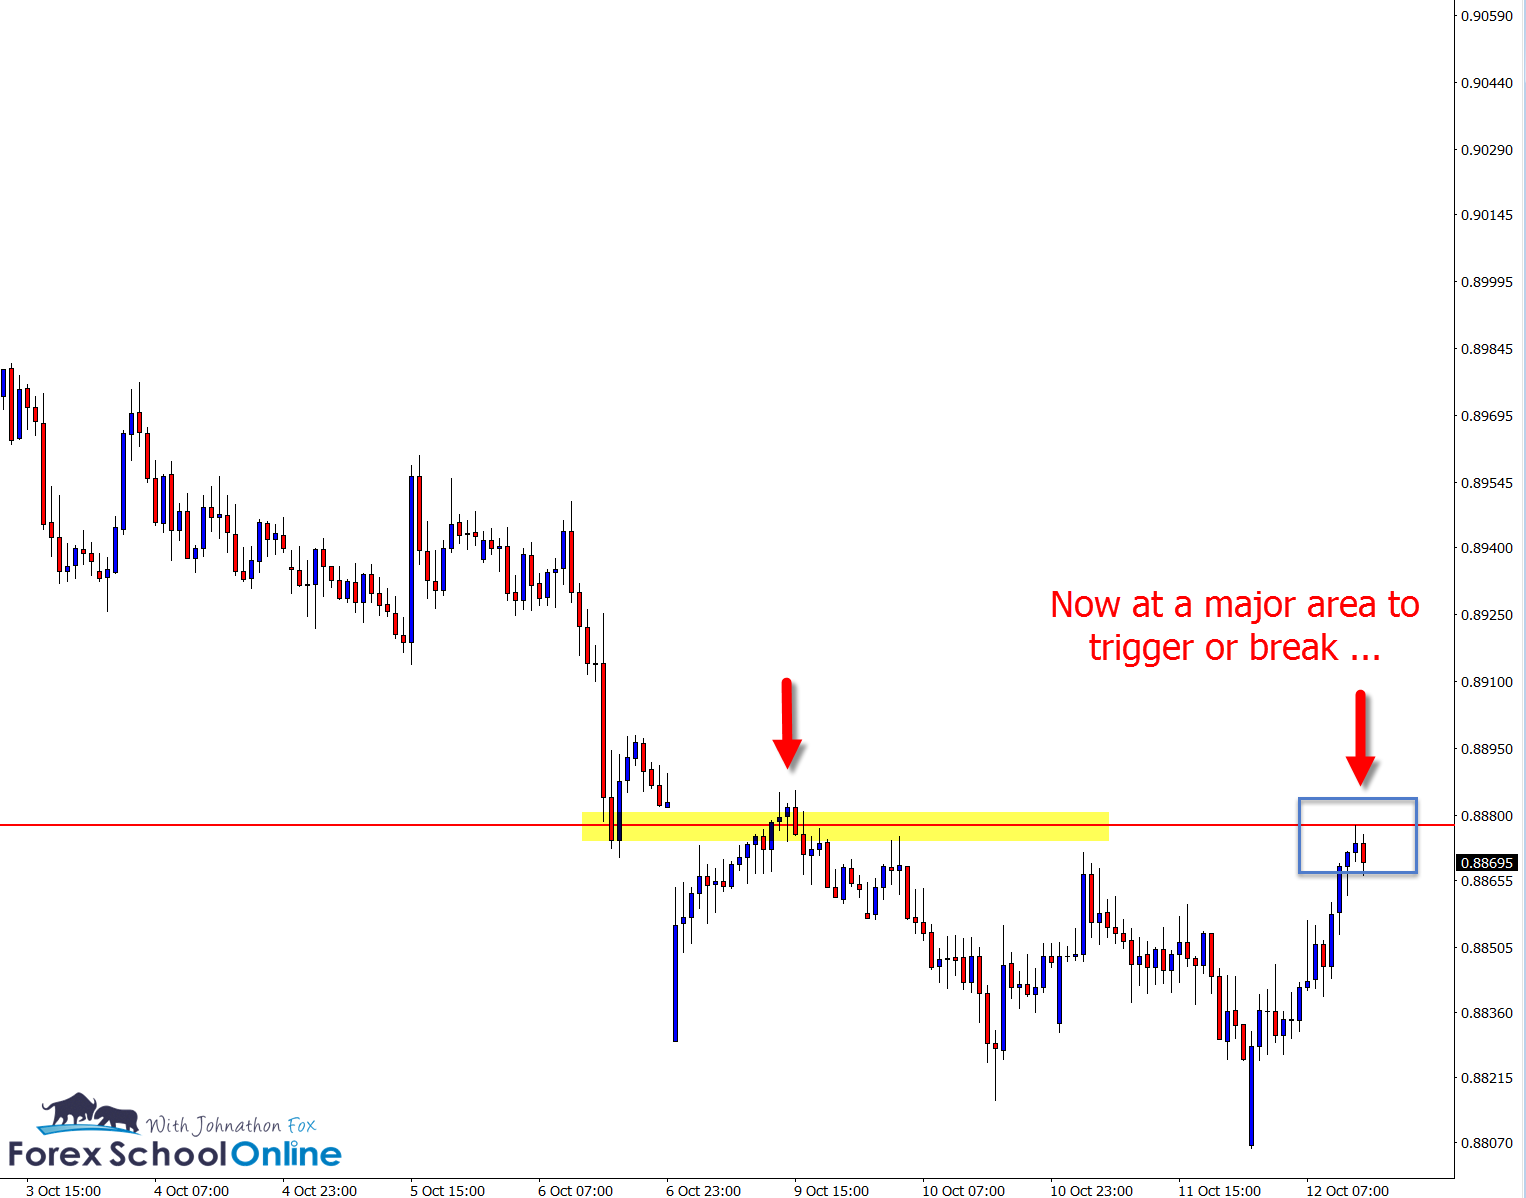
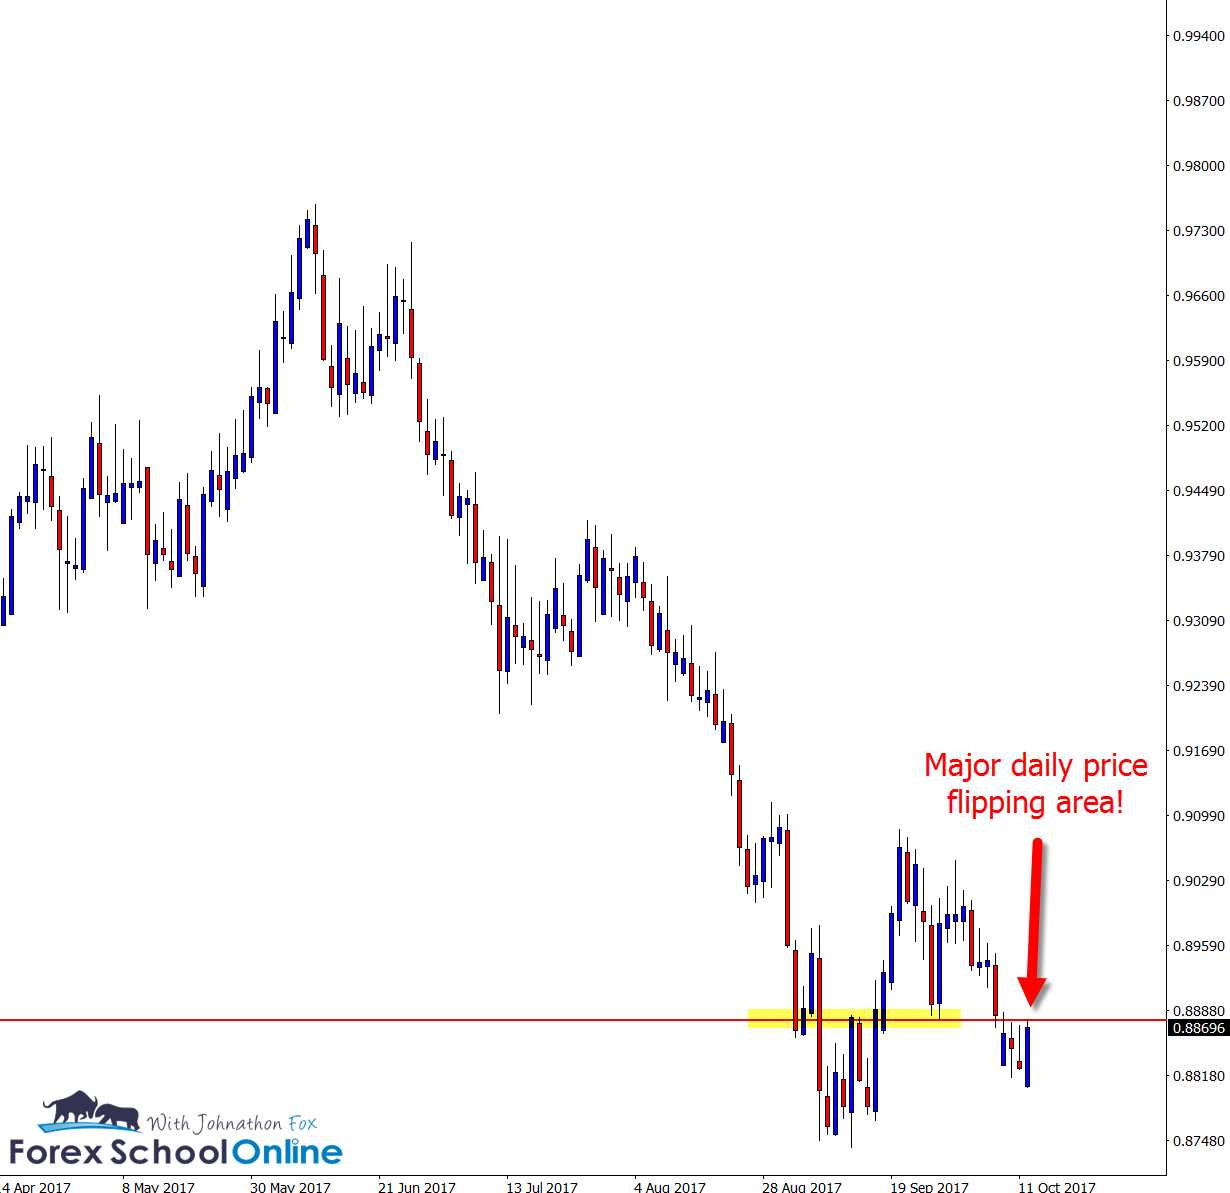
When I was looking and taking this screenshot of this chart on the NZDCAD daily and 1Hour price action charts price action was sitting right at the major price flip level.
Price on the daily chart has been screaming lower in a downtrend, but on the smaller time frames the trend is not as clear cut…
That is why I have attached the 1 hour chart.
One of the most high probability and also simple price action trades we can look for is a really simple and strong trend in either direction, a quick pullback and then to enter in that same direction.
If you have a look at the 1 hour chart on your own charts right now; you will see that price made a first test of the price flip resistance level, rejected it and moved lower as it often does when in a strong trend lower like this.
That is a normal and high probability rejection when looking to make a quick pullback into a price flip.
The first test of any level will often be the strongest test because that is where the biggest orders have re-stocked or built up.
I discuss this in the lesson; Using the First Test of Support & Resistance Price Action Strategy
We can see price on the smaller time frames is now in a more sideways and base pattern and will be super interesting to watch at this level.
NZDCAD Daily Chart
NZDCAD 1 Hour Chart


Leave a Reply