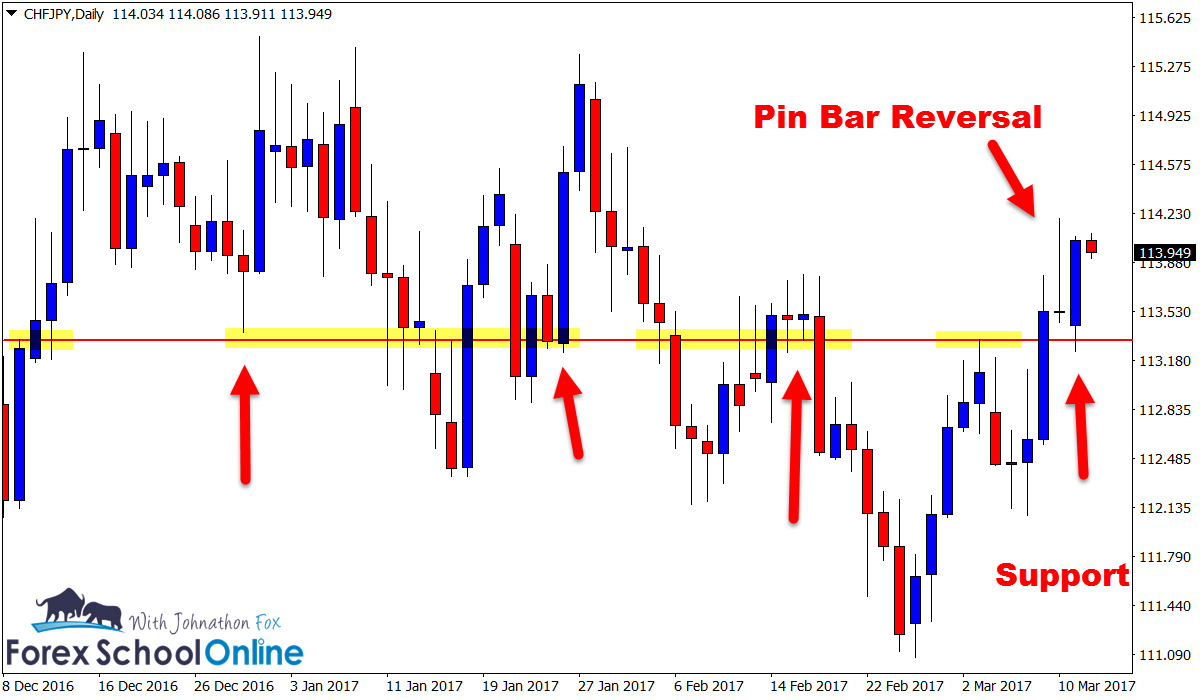
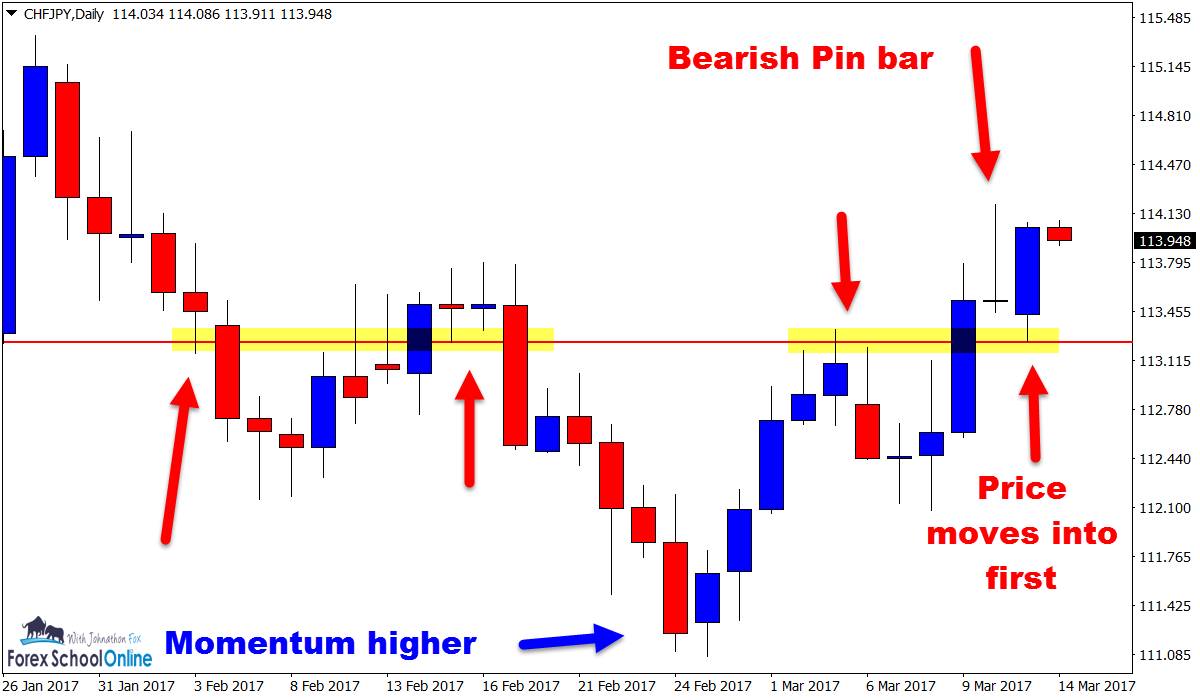
Price on the daily chart of CHFJPY formed a Bearish Pin Bar reversal that was up at the high by itself and looked a fairly solid pin bar reversal.
When looking to identify the market type and the overall price action story – keeping in mind that the price action story is KING and the trigger is used as confirmation or as a way to simply enter the trade, we can see that in the very recent short-term price was looking to complete a 1,2,3 with a new higher high.
In the more medium term price is sideways and making a big consolidation. If you move to this pair and zoom your daily chart out, what you will notice is that after the very strong move higher price has been trading sideways since November last year, not making any major moves higher or lower.
That brings us back to the pin bar reversal and that question if it failed or if it passed.
What I am looking at and I question in similar setups to this pin bar is; what happens after price moves away from the pin bar or setup.
As soon as price broke below this pin bar it was going to move into a support level and into a super dangerous area for price making any moves lower. Any traders in this trade looking for price to go lower would have to flick the red alert button on as soon as price gets to this level.
You cannot disregard or simply ignore these levels. Price doesn’t just ignore levels because we are.
Before I leave… make sure you are aware of the changes to your charts candles. If you are trading with the correct New York Close 5 Day Charts then the candles changed over the weekend and you should have received an email.
If you don’t have the New York close charts you can Get a Free Demo Here.

CHFJPY Daily Chart

CHFJPY Daily Chart

Related Forex Trading Education


Leave a Reply