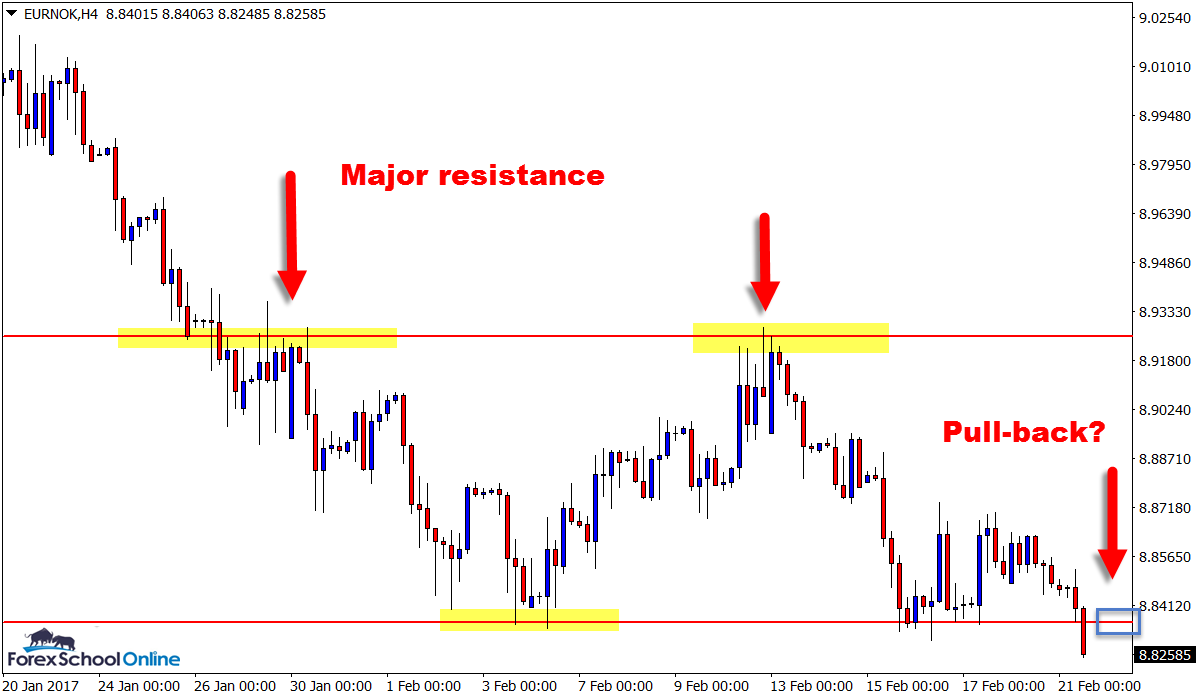
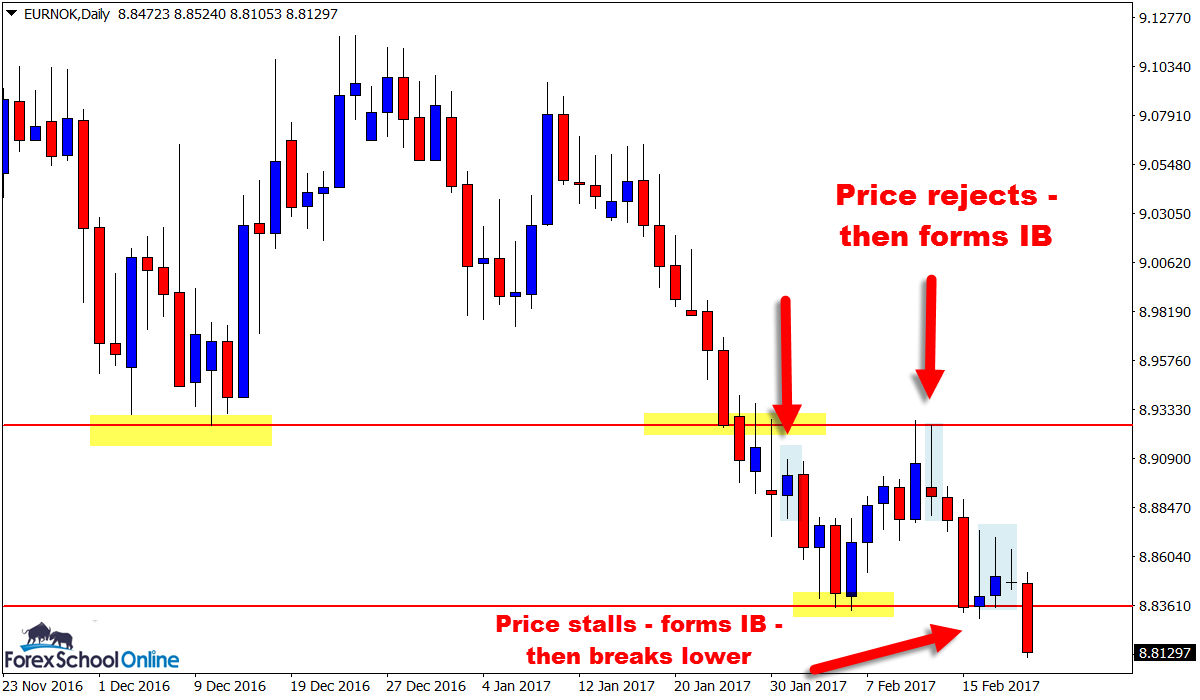
Price on the daily chart of the EURNOK chart has formed back-to-back Inside Bars = IB’s sitting right on-top of a major support level that was also a key price flip for this market.
These Double Inside Bars have acted as price clues and footprints for price to make a breakout attempt that is in progress as I make this ‘charts in focus’ post for you now.
Whilst I make this post; price is attempting to smash out lower through the price flip level and major support.
Inside bars are great price action clues for this type of breakout ESPECIALLY when they form on-top of major levels and price flips, and even more so when they form more than one like is the case here.
When we begin to see price winding up and price is winding tighter, we know that the market is contracting and a break is coming and normally the bigger and longer the windup the more explosive this break will be.
When we then combine that with a very strong level as well it can increase the strength of the breakout.
Now that price is attempting to breakout on the daily chart and trying to make a move lower, looking to make trades inline with this breakout would be the best play unless the market tells us otherwise.
I have uploaded three charts below.
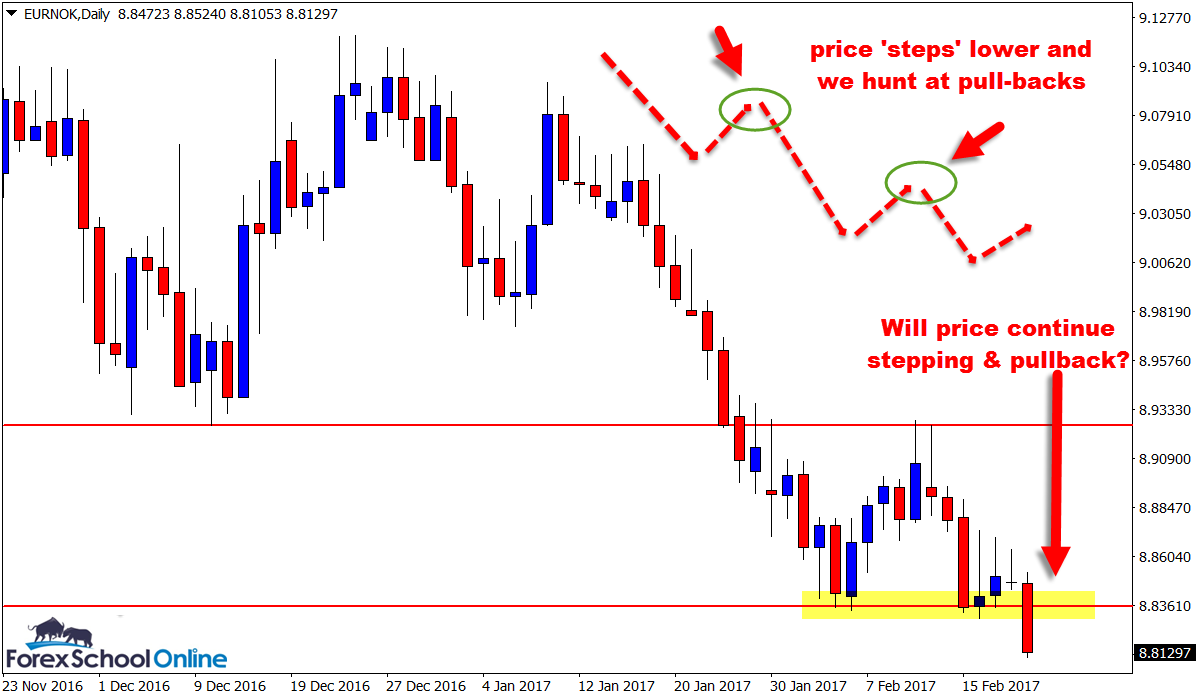
You will notice that on one of the charts I have added an illustration of “Stepping”. Stepping is a super high probability market pattern where price ‘steps’ either higher or in this markets case lower.
You will notice that just in recent times price has made a series of ‘steps’ with lower highs and lower lows. We want to be looking for our trades at the value areas and the swings back.
I have a lesson that explains this and exactly where you should hunt your A+ trades at; What You Should Know About Hunting A+ Price Action Trades
Any questions or anything just post them below.
Daily EURNOK Chart
Daily EURNOK Chart
4 Hour EURNOK Chart

Related Forex Trading Education


Leave a Reply