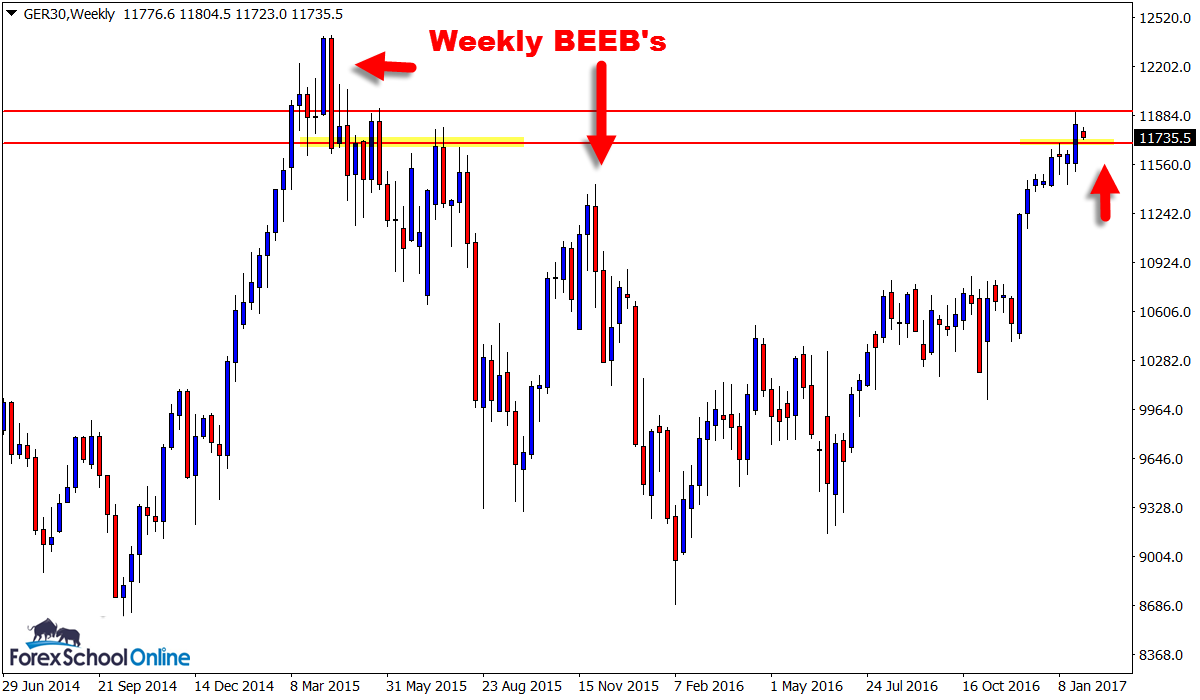
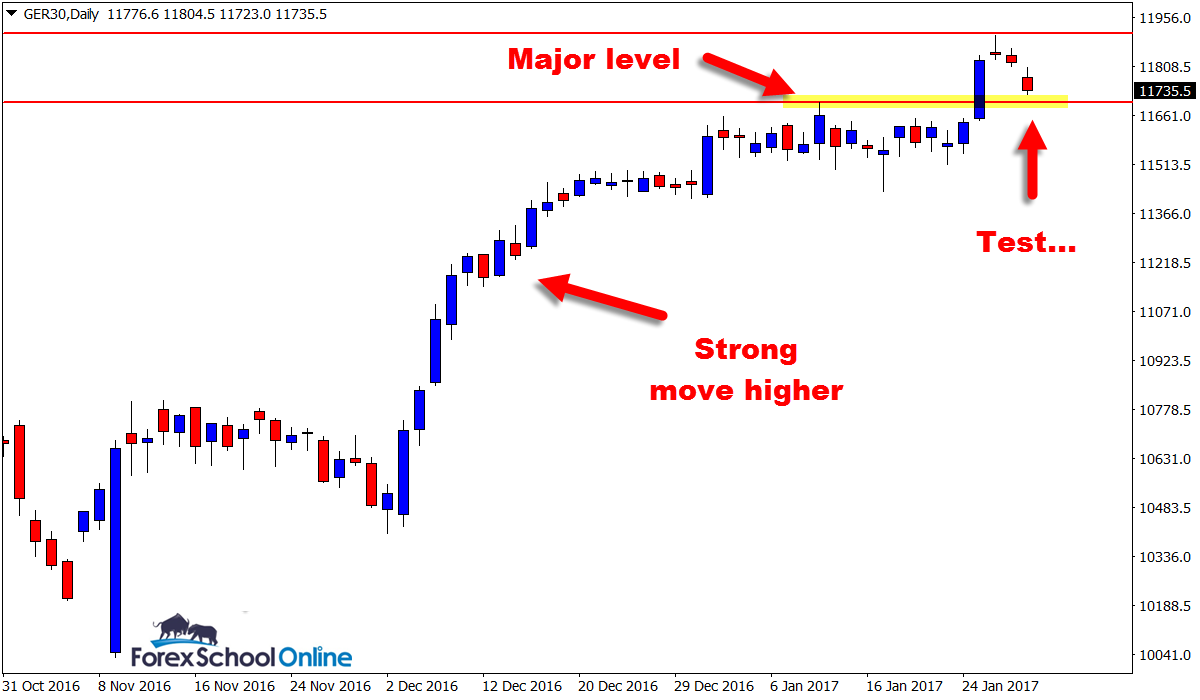
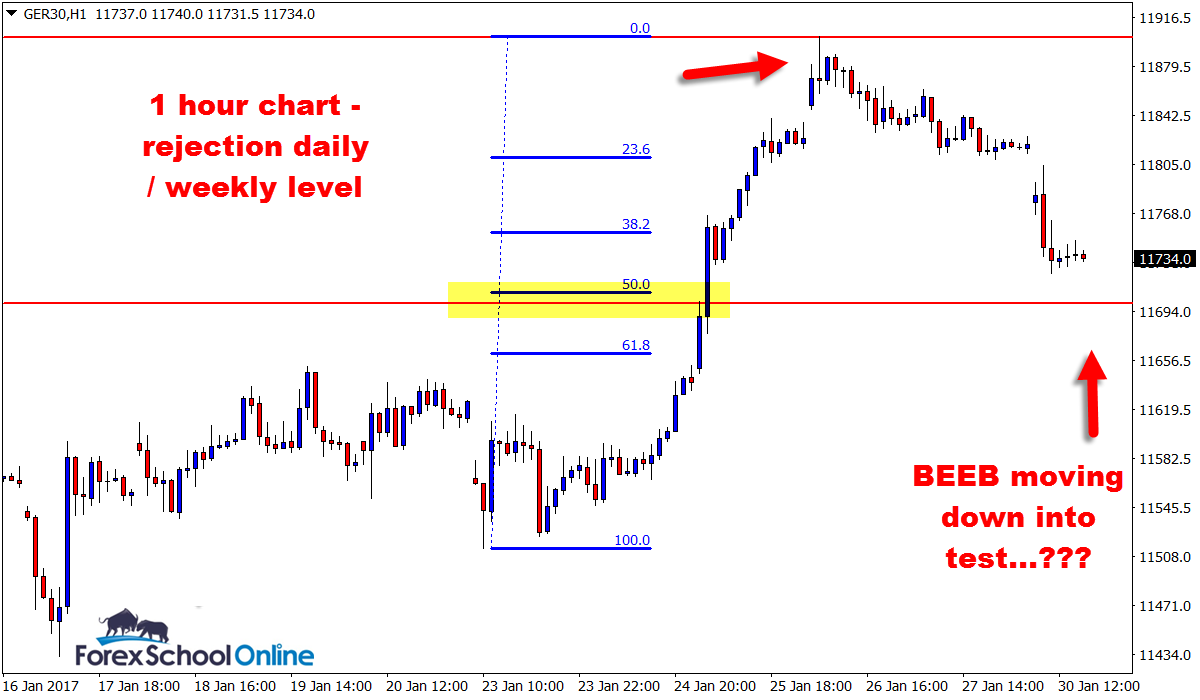
As I have shown on my charts below, price action is moving lower on the Germany 30 (GER30) at a rapid pace.
This could be a crucial support level for both price in the coming sessions for determining where it goes, but also for keen price action traders who will be watching this like a hawk…
As you can see below I have attached three charts below;
1: Weekly Time Frame
2: Daily Time Frame
3: 1 Hour Time Frame
Side note: You will notice the 1 hour chart has a Fibonacci on it which is super rare, but something I will do from time to time for confluence and an added tick in the box when looking for super high probability setups.
I need to make this clear before moving on – The price action is always making the trade decisions. The Fibo is an added tick in the box, adding an extra layer of confluence to an already high probability solid level.
If there was no level, there would be NO trade.
What is super intriguing about this is that there is such a strong, continued momentum higher. That is a BIG tick in the box. We would be trading inline with that and now price has made a rotation back lower into a value area we would also be trading from a swing low and from a support level.
I have a lesson and video that show you how to hunt A+ high probability price action setup using the Trend to increase your profits and lower your risk. Get it;
Hunt Super High Probability Trades Using the Trend as Your Friend
There will be a close watch on this market now and any potential price action trades will require an A+ trade reversal trigger setup to be used as a confirmation to enter the market.
GER 30 / Weekly Chart

GER 30 / Daily Chart

GER 30 / 1 Hour Chart

Related Forex Trading Education


Leave a Reply