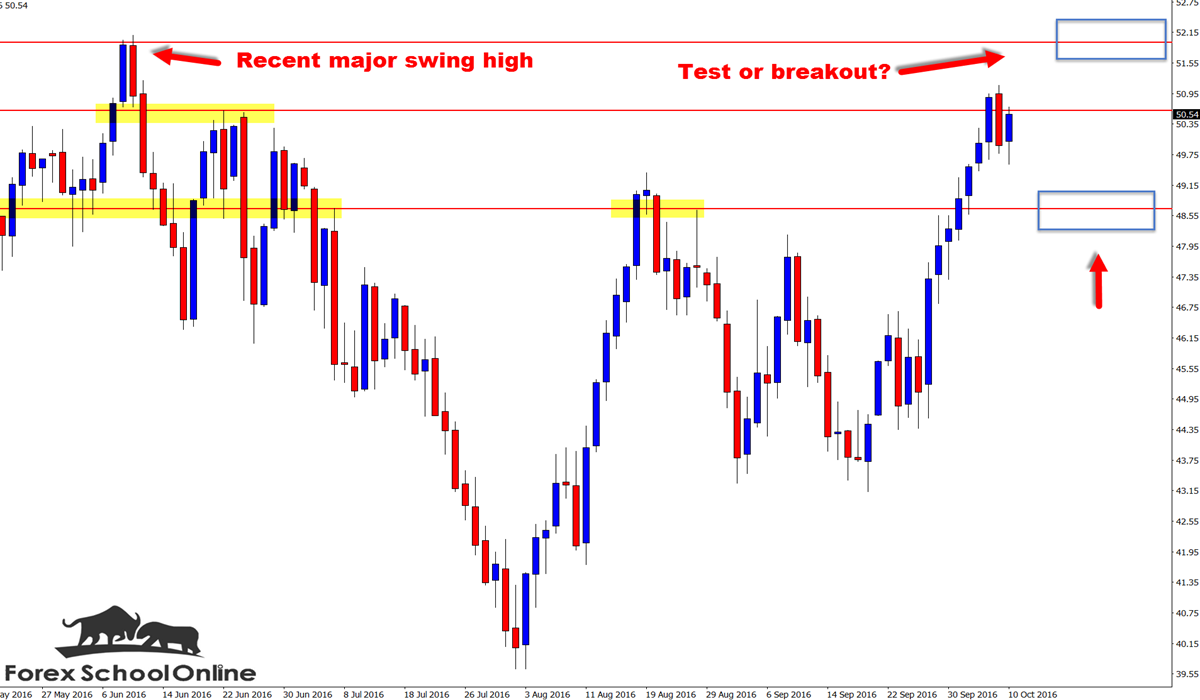
Price in the Oil market has been choppy and sideways over the medium term, but in the shorter term we can clearly see on the daily chart that all the momentum has been pushing higher.
If you have a look at the chart I have attached for you below, you will see that price on Oil v USD in recent days has been making a strong move higher and if it continues it could move straight into the next major resistance level overhead.
The market type we make our trades in is obviously critical to making an A+ high probability trade setup. To help you make high probability price action setups I have an Introduction Guide to Trading Price Action Strategies to read here.
With price looking to push higher and into the resistance overhead it could open the way to watch this market really closely for potential trade setups. There are two possible ways we could look to play this market if price moves higher into this resistance overhead.
The first way is the straightforward bearish rejection setup, where we’d look for price to fire off a really solid A+ trigger signal like we teach our members on the Members Only Price Action Courses so we can get short. You should make sure you have room to make the trade and enough space, just like I discuss in the most recent lesson:
Do Not Make These 7 Killer Trading Mistakes + FREE BONUS
The other potential way to hunt a trade if price does move higher and into the level overhead is to wait like a Forex sniper and see if price breaks out and through the level.
If price does break through and above, then we could move to our smaller intraday time frames such as our 4 hour, 1 hour and potential even smaller time frames and look for price to quickly pull-back into the old resistance and new price flip support to get long with the breakout move.
Take a look at the chart below where I have added the scenarios to show you:
Daily Oil v USD Chart

Related Forex Trading Education


Leave a Reply