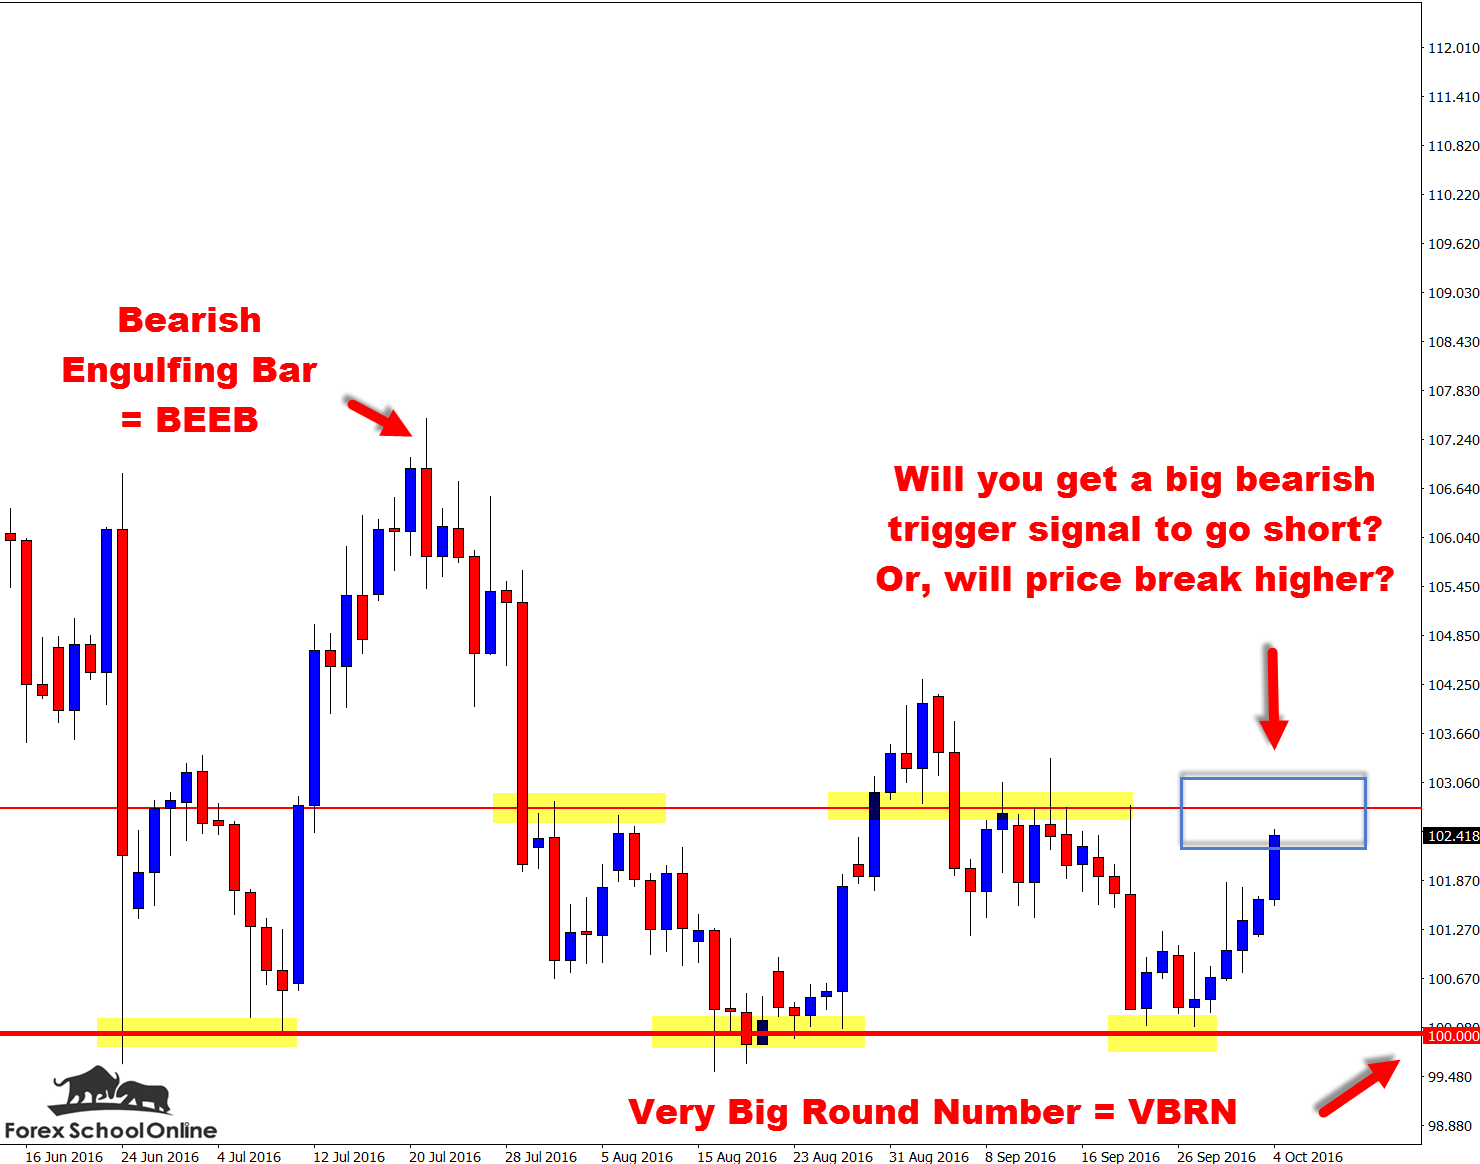
Price action on the daily chart of the USDJPY is now moving into and looking to test the major daily resistance and price flip level as I write this ‘charts in focus’ for you.
How You Can Use Very Big Round Numbers
Price is only at this level because after making a crash lower in one huge candle move lower price fell into the Very Big Round Number of 100.00. I have spoken about how you can use these Very Big Round Numbers to your advantage in your trading many times and used a lot of examples, mainly because they come up time and time again just like this setup today.
What you really don’t want to do with these VBRN’s = Very Big Round Numbers, is just go and find a random number and use that as your level.
Instead, just like we have here, you want to find the VERY BIG ROUND NUMBERS, that are also support and resistance levels.
What you will normally find is that the two go hand in hand because what makes one, makes the other and they work for the same reasons.
These big psychological levels become obvious just like the confirmed price flip levels that are clear daily levels. They are repeated time and again and traders start to become aware of them and factor them in with everything they are doing, so even if they don’t place their entry or stops right on the VBRN 100.00 exactly, they may place it at 100.03 or 99.98 etc, and then the next trader at 100.04, and then all of a sudden we have a vacuum where order flow builds all around this BIG NUMBER!
Big Watch on Daily & Intraday
With price now moving higher and potentially into the resistance level, we can watch the resistance level really closely to see what happens and to pay close attention to the price action behavior.
If price fires of a High Probability Bearish trigger signal you could look to make a short setup, depending on obviously the rules in your trading plan. You can get your 7 Step Pre-trade checklist that shows you exactly what you should be looking for to tick off so you can make high probability price action entries;
Get Your 7 Step Checklist
The other option is of course if price breaks out higher. If this does happen, then we could watch super dooper closely to see if price makes any quick pull-backs into the old resistance & new support price flip area to get long with the momentum that price would have on the move higher.
Check out the charts below;
Daily USDJPY Chart
4 Hour USDJPY Chart

Related Forex Trading Education


Leave a Reply