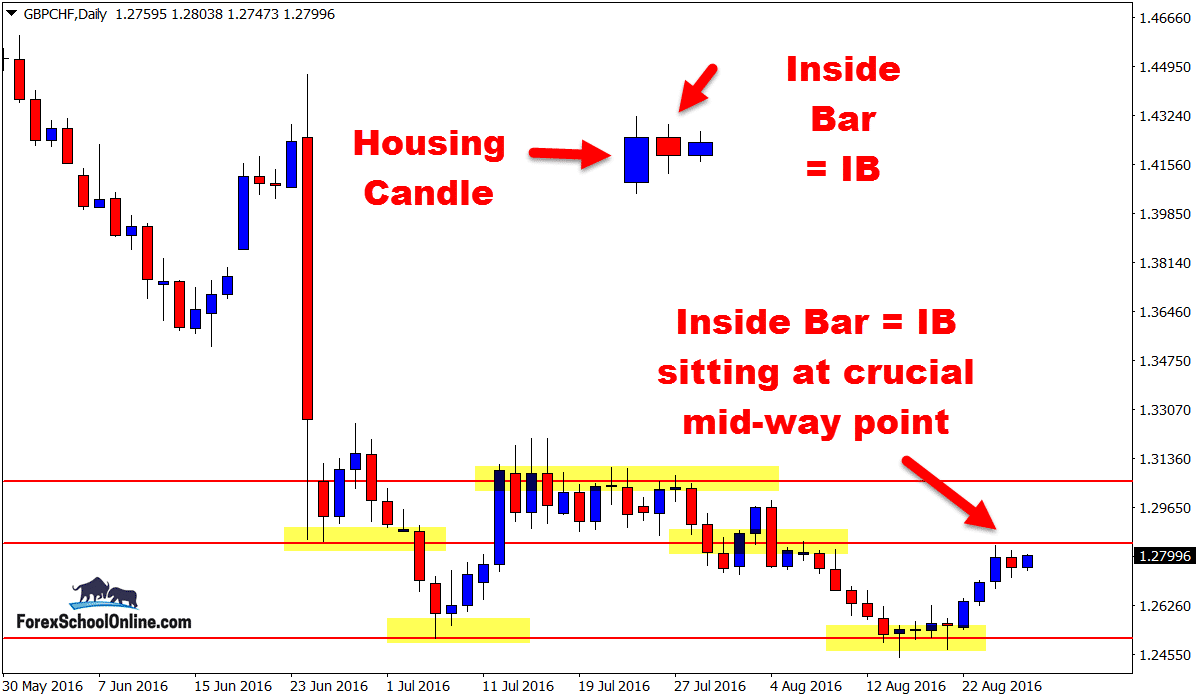
Price has fired off an inside bar = IB that is right in the middle of a recent tight range on the daily price action chart on the GBPCHF Forex pair.
Inline with the HUGE Brexit related moves lower that a lot of the GBP pairs have mostly been making, price in recent times had been making strong moves lower and price was looking to continue this until it run into a roadblock that was the major support level. See the charts below;
Price started to form a base and double low. It is super dooper rare if price is going to attempt a market reversal for it to just up and turn around, especially when combating such a strong amount of order flow in the opposite direction as we have seen here.
The easiest way to think of this is like teams of bulls (buyers) versus bears (sellers).
As price is making the strong move lower the bears are in control and they hold all the order flow. When they get to the bulls (buyers) line, the buyers/bulls begin the fight back and start to push strongly back at the bears/sellers.
I discuss and go through how a reversal is then completed and also how you can look for high probability trigger signals to take advantage of them in the lesson;
How to Read a Price Action Market Reversal & Take Advantage When it Happens
We can see on the daily chart that price has formed the double low, but no other indication just yet of price making a market reversal. For example; we have not seen a major level broken or a 1,2,3 reversal pattern etc,.
What we do have is the super interesting Inside Bar = IB that is also at a very keen spot in the market place for price action traders and also at a super interesting time of the week being so close to market close.
This inside bar is just underneath the what we call “mid-way” point of the tight box or range that price is currently sitting in. You can see price has the clear low it has now moved off from and then you have the Big Round Number of 1.3000 and other swing high / matching candle resistance levels sitting up ahead.
Side note; If you want to learn more about the inside bar or how to trade ‘combo’ setups, then the strategy lesson for you to check out is; How You Can Trade the ‘Combo’ Trigger Strategy
Daily Chart GBPCHF

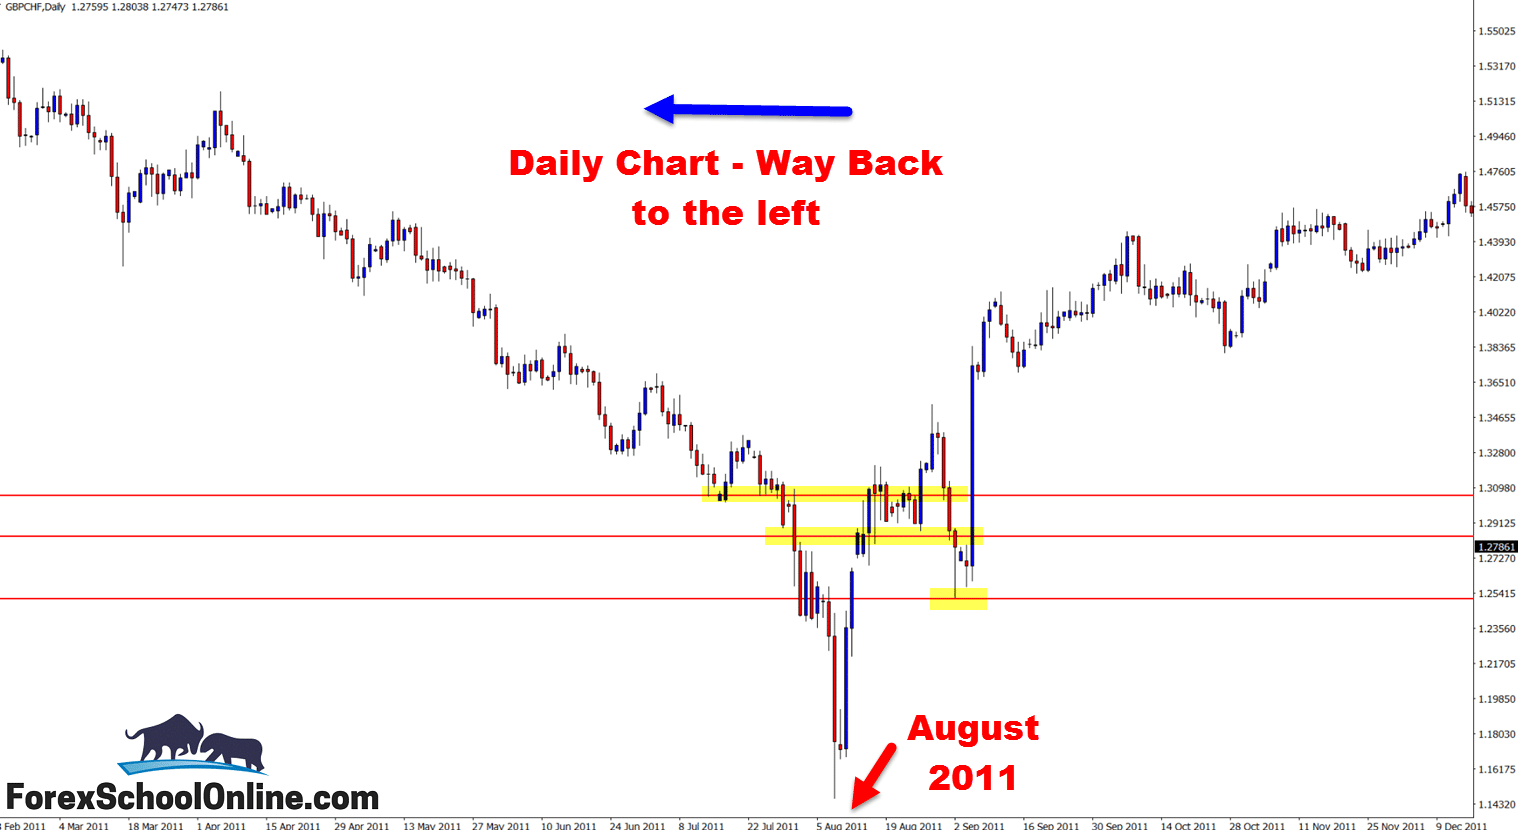
Daily Chart GBPCHF Showing Major Levels of Previous Years – August 2011
The chart below is showing price action and support/resistance levels on the same daily chart, but the chart has been scrolled back to show you the major levels right back to 2011.

Related Forex Trading Education


Leave a Reply