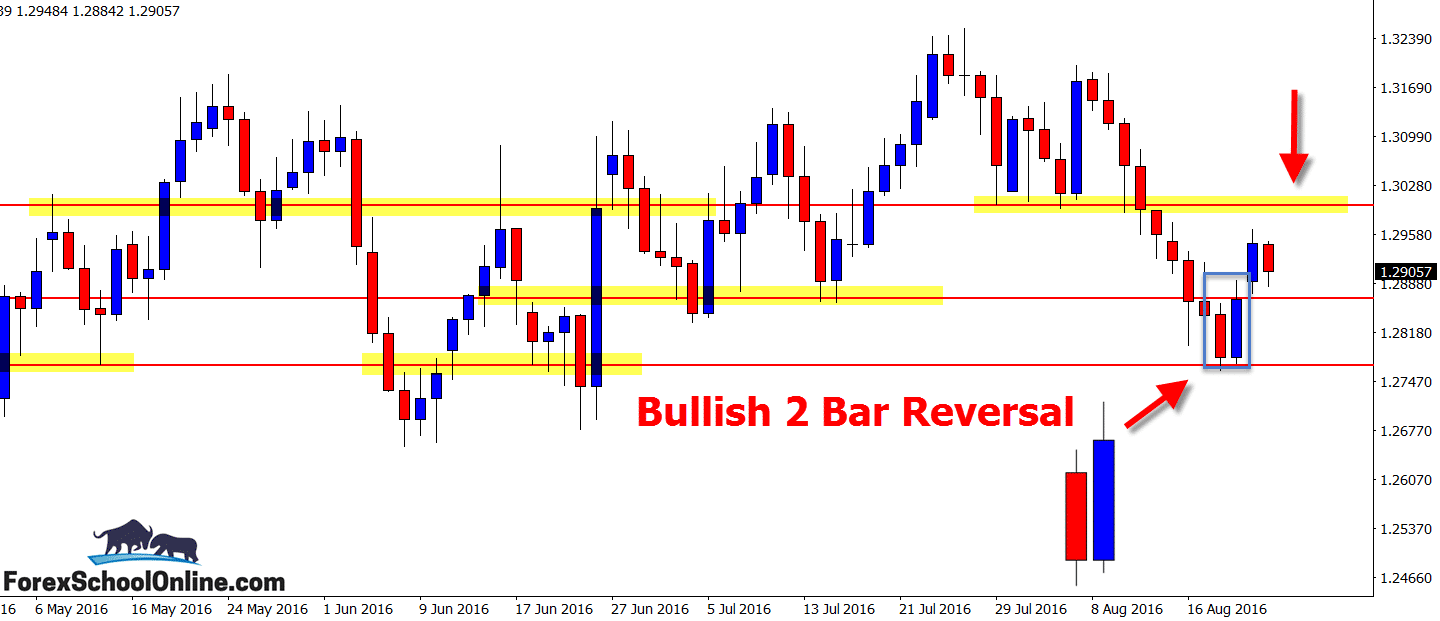
Price on the USDCAD has fired off a Bullish 2 Bar Reversal that is as I write this ‘Charts in Focus’ summary for you is attempting to push price higher on the daily price action chart.
As you can see on both of my charts that I have attached for you below, but especially the chart that I have blown up the 2 bar reversal on, the bullish 2 bar is down right at the swing low and daily support area.
After confirming the 2 bar reversal by breaking and moving higher, price has now stalled and as yet has not been able to break the highs of the previous session.
I am often emailed and asked about how we should enter reversals trades such as the pin bar and 2 bar reversal and what the highest probability entry is. You can read an in-depth Forex lesson on how to make entries on reversals to cut losses and make sure you are always entering with the momentum on your side in the lesson at:
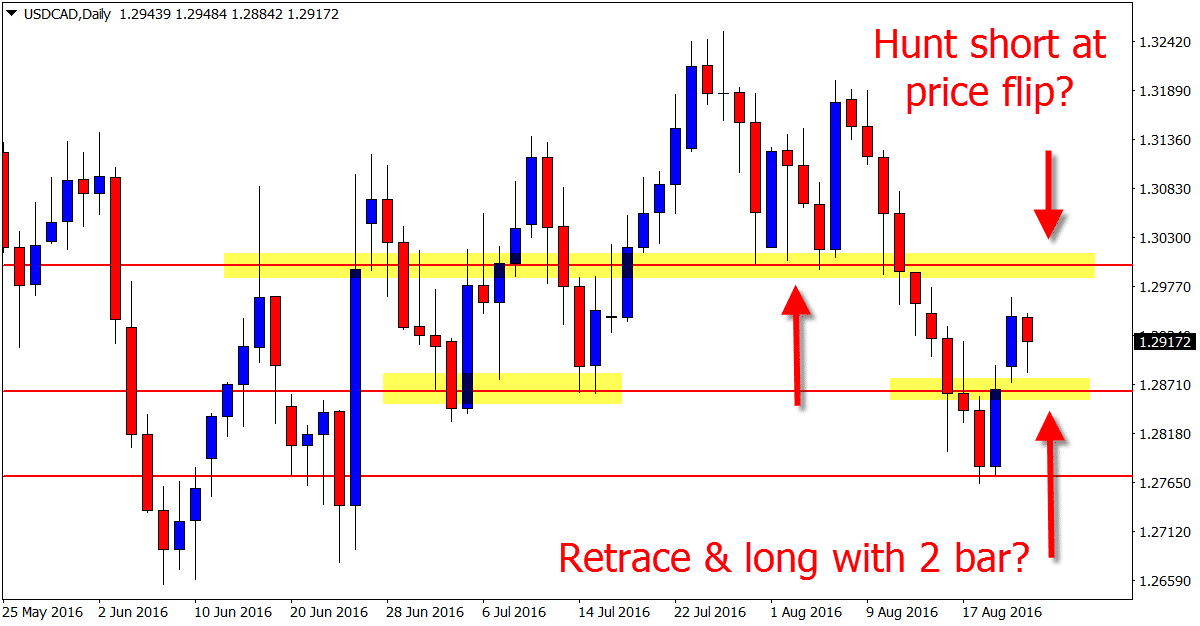
At the start of this year, price was in a roaring trend lower, making lower low after lower low and looking like not much was going to stop it. However, if you now look at this daily chart from left to right, it is a big bag of potatoes, and for the last few months price has not moved higher or lower from the box/range it is in.
Whilst price is now stalling, it could be looking to make a quick retrace and re-test of the level it has just busted out of. For intraday, smaller time frame traders this could present a quick trading opportunity to look for fast pull-back and long trade setups, keeping in mind that this market is ranging and choppy and especially so as we move to smaller time frames.
If price can continue its move higher, then there is an overhead price flip and resistance that is also a Big Round Number (“BRN”) in the way of 1.3000 that could present a high probability level to hunt for short trade setups. For any potential short trades to be confirmed we would need to see a really A+ trigger signal.
Daily USDCAD Chart

Daily USDCAD Chart

Related Forex Trading Education


Leave a Reply