GBPUSD 8 HOUR CHART
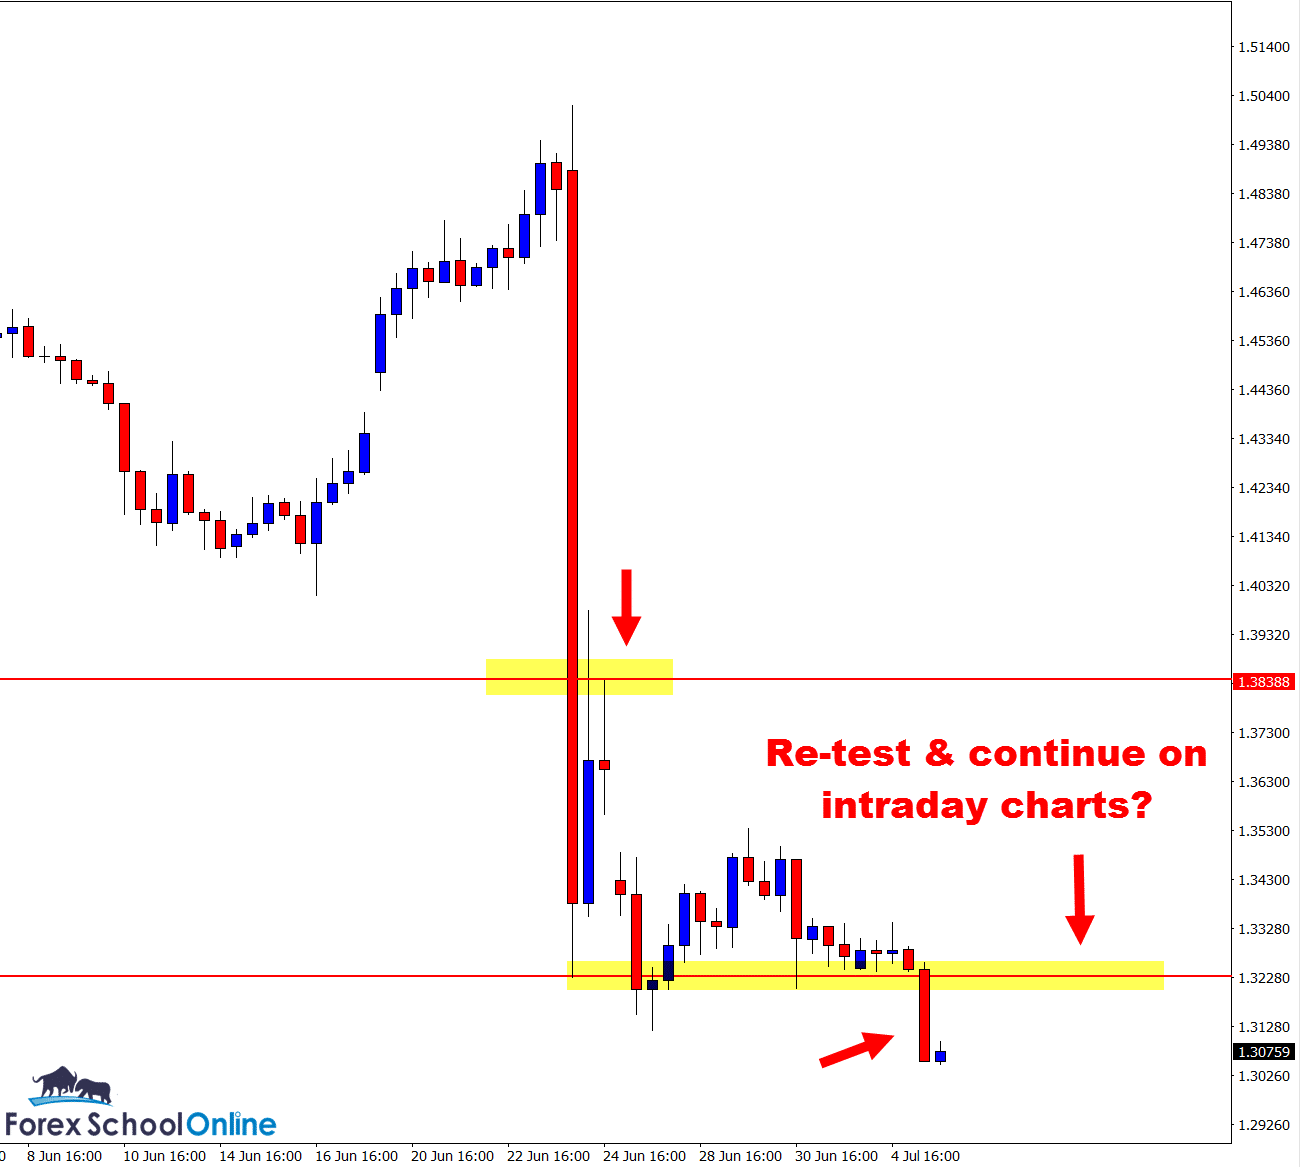
The BREXIT sure did shake things up in this market, forcing a really big move.
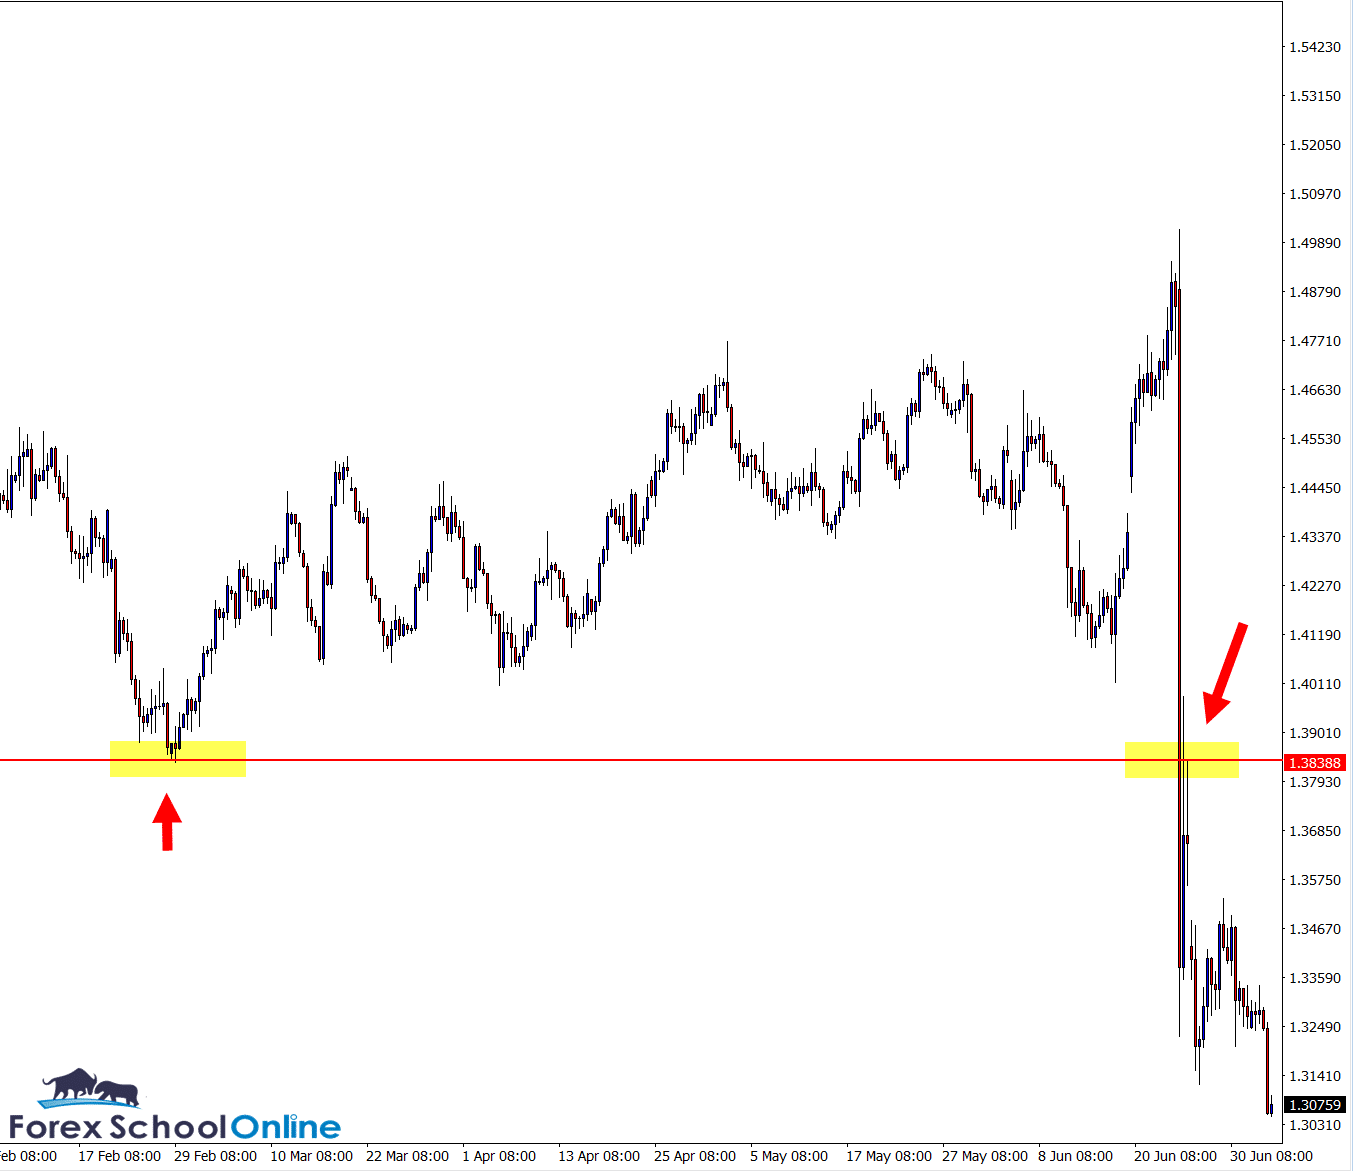
How often do you see Engulfing Bars engulfing half a year’s worth of price action on a chart? Especially on a major pair like the GBPUSD. It just goes to show the size and importance of the move.
The other super rare thing to note is that in just a couple of sessions we have gone from testing the Very Big Round Number 1.5000 to testing the Very Big Round Number 1.3000. In 2015 this pair opened and closed the year at almost the same level – almost to the pip, so for price to crash this low in 2 sessions is quite something!
Price made retracements throughout this move all the way giving price action traders who were watching and were aggressive chances to either getting into breakouts or reversals.
There is now the potential to do the same and once again hunt short trades on smaller intraday time frames should price pop higher with a retrace.
8 Hour GBPUSD Chart
8 Hour GBPUSD Chart – Zoomed Out
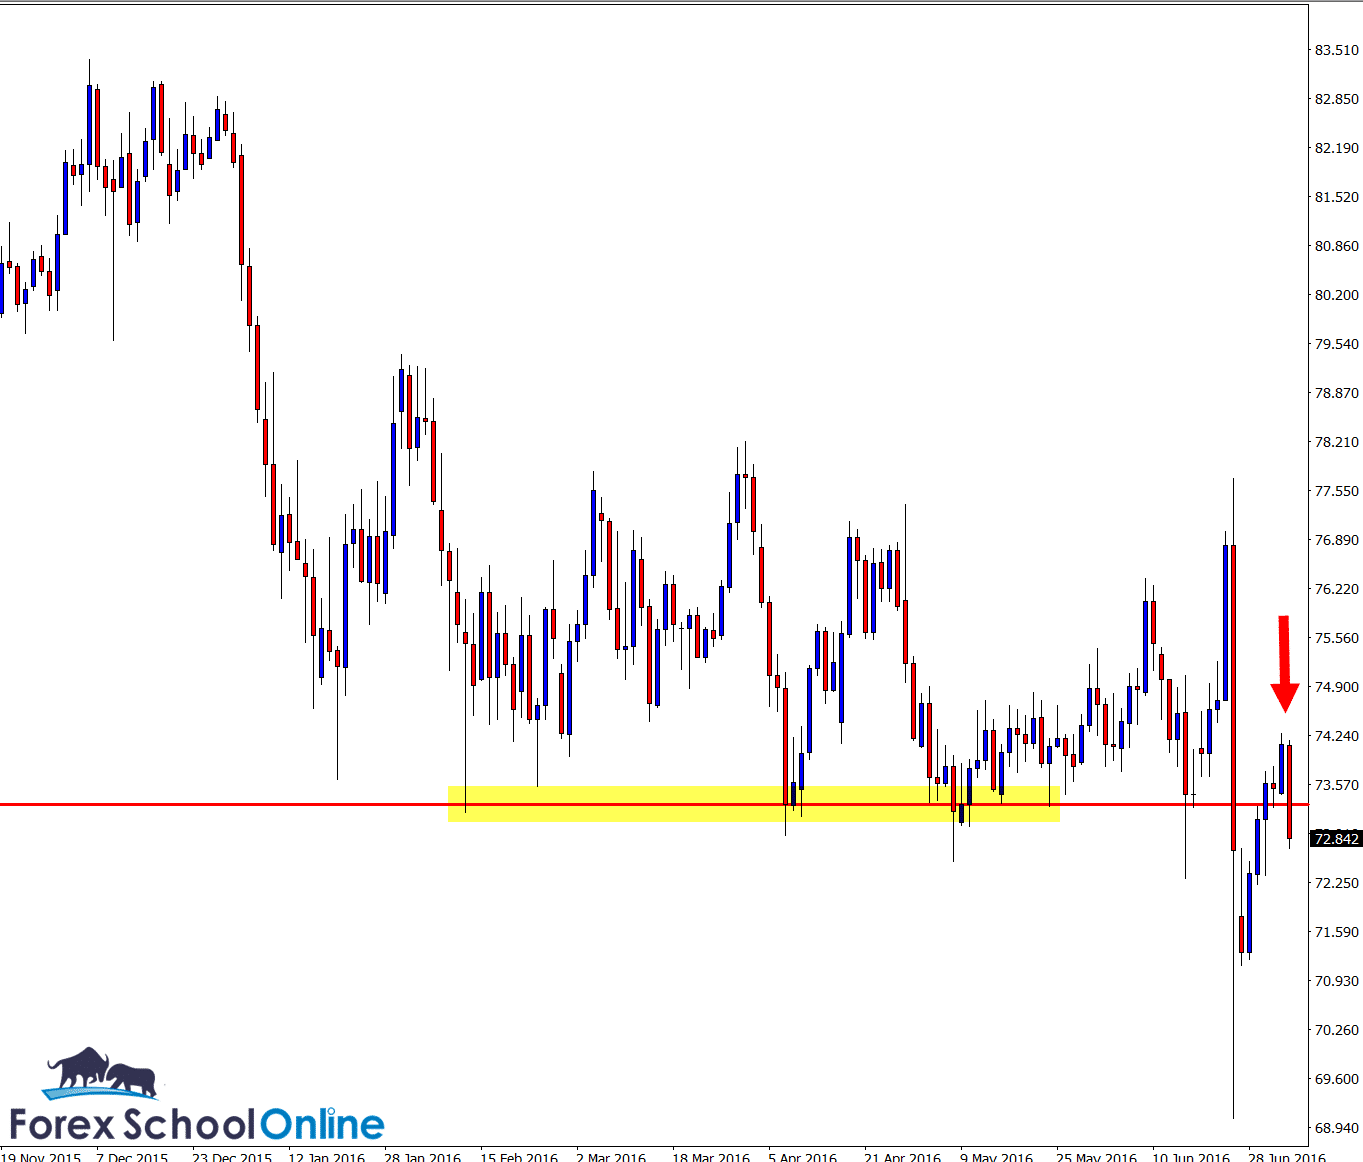
NZDJPY DAILY CHART
Whilst this pair is in a very sideways ranging pattern, if price is able to break the major level that it is tussling with as I write this up for you, there is a lot of space lower for price action to break into.
I talk about this and the best high probability strategies for you to trade price action range and sideways markets in the lesson:
How to Make High Probability Trade Setups in Range & Sideways Markets
If price moves higher there is a lot of traffic and that could make it really tricky for not only potential high probability trades, but for managing those trades once in them. However, if we take short trades we have a higher chance of managing the trades successfully without the risk of all the minor levels getting in the way.
Daily Chart NZDJPY
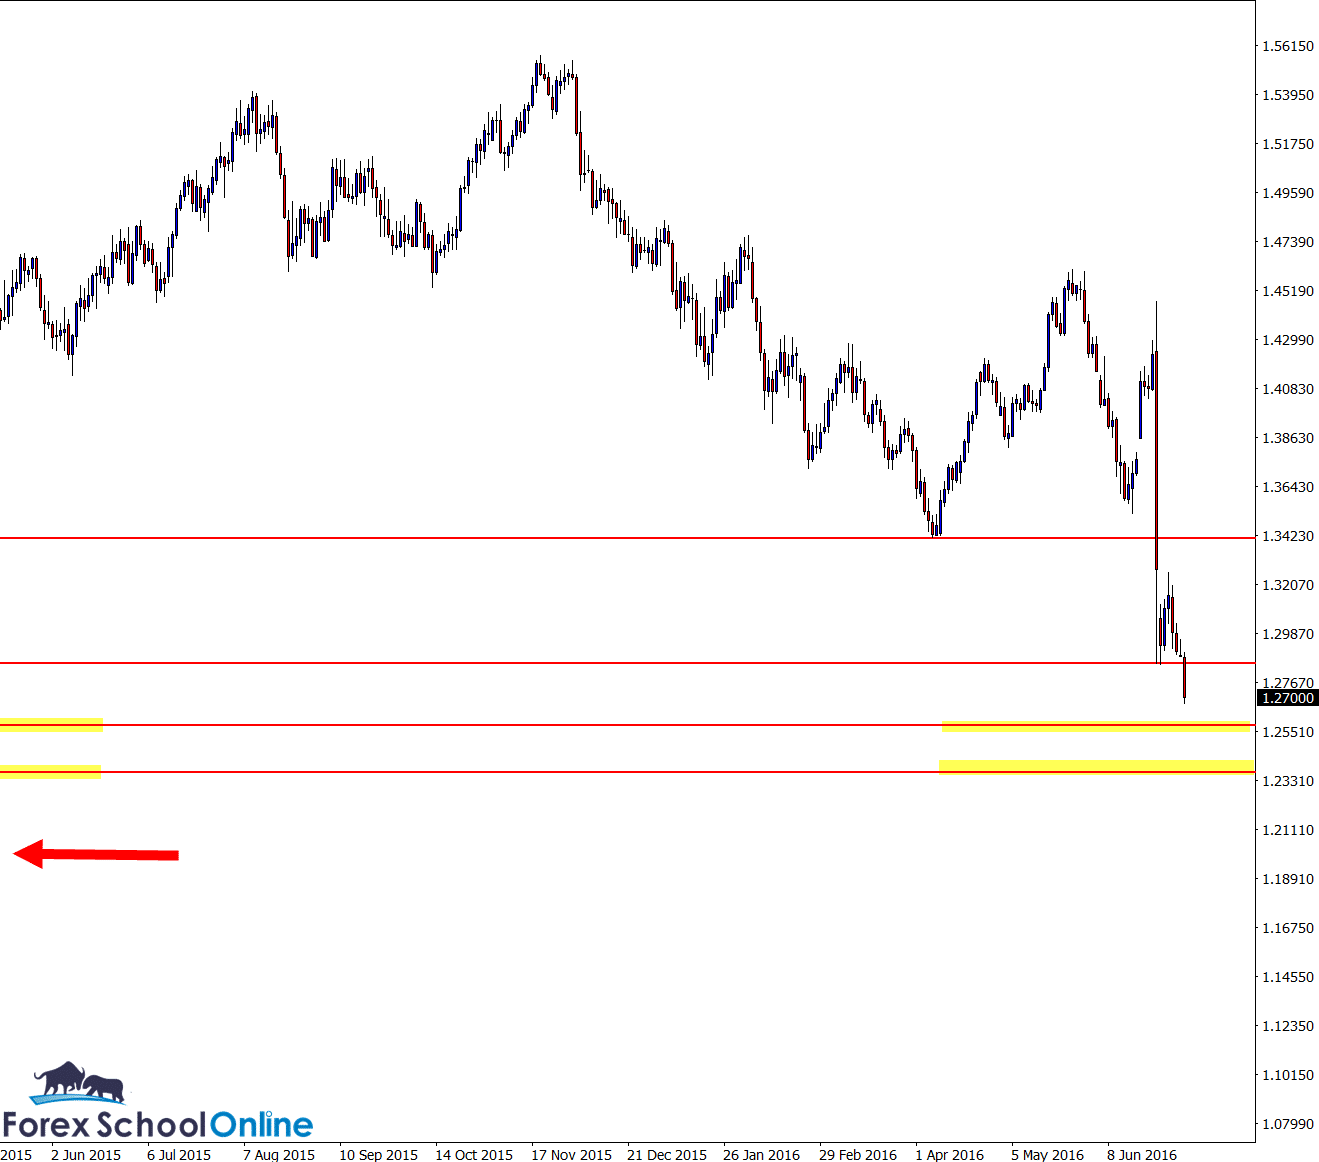
GBPCHF DAILY CHART
As you can see on the zoomed out chart below, this market has a ton of room to fall into if price can continue.
After making the massive break last week, price paused and has once again broken and continued lower. If you flick to your own weekly chart you will see a huge weekly pin bar and it is down to these sorts of levels that price could be heading if price now continues with the recent strong momentum.
As we often discuss and talk about in here in the ‘Chart in Focus’, the best play is to trade with the obvious market momentum in our favor, rather than try and fight it. The obvious momentum here is clearly lower.
Any signs of strength or rotations back higher and we could look to hunt for short trades. Any potential short trades would need to be confirmed with high probability A+ trigger signals like the ones taught in the Forex School Online Price Action Courses.
Daily GBPCHF Chart
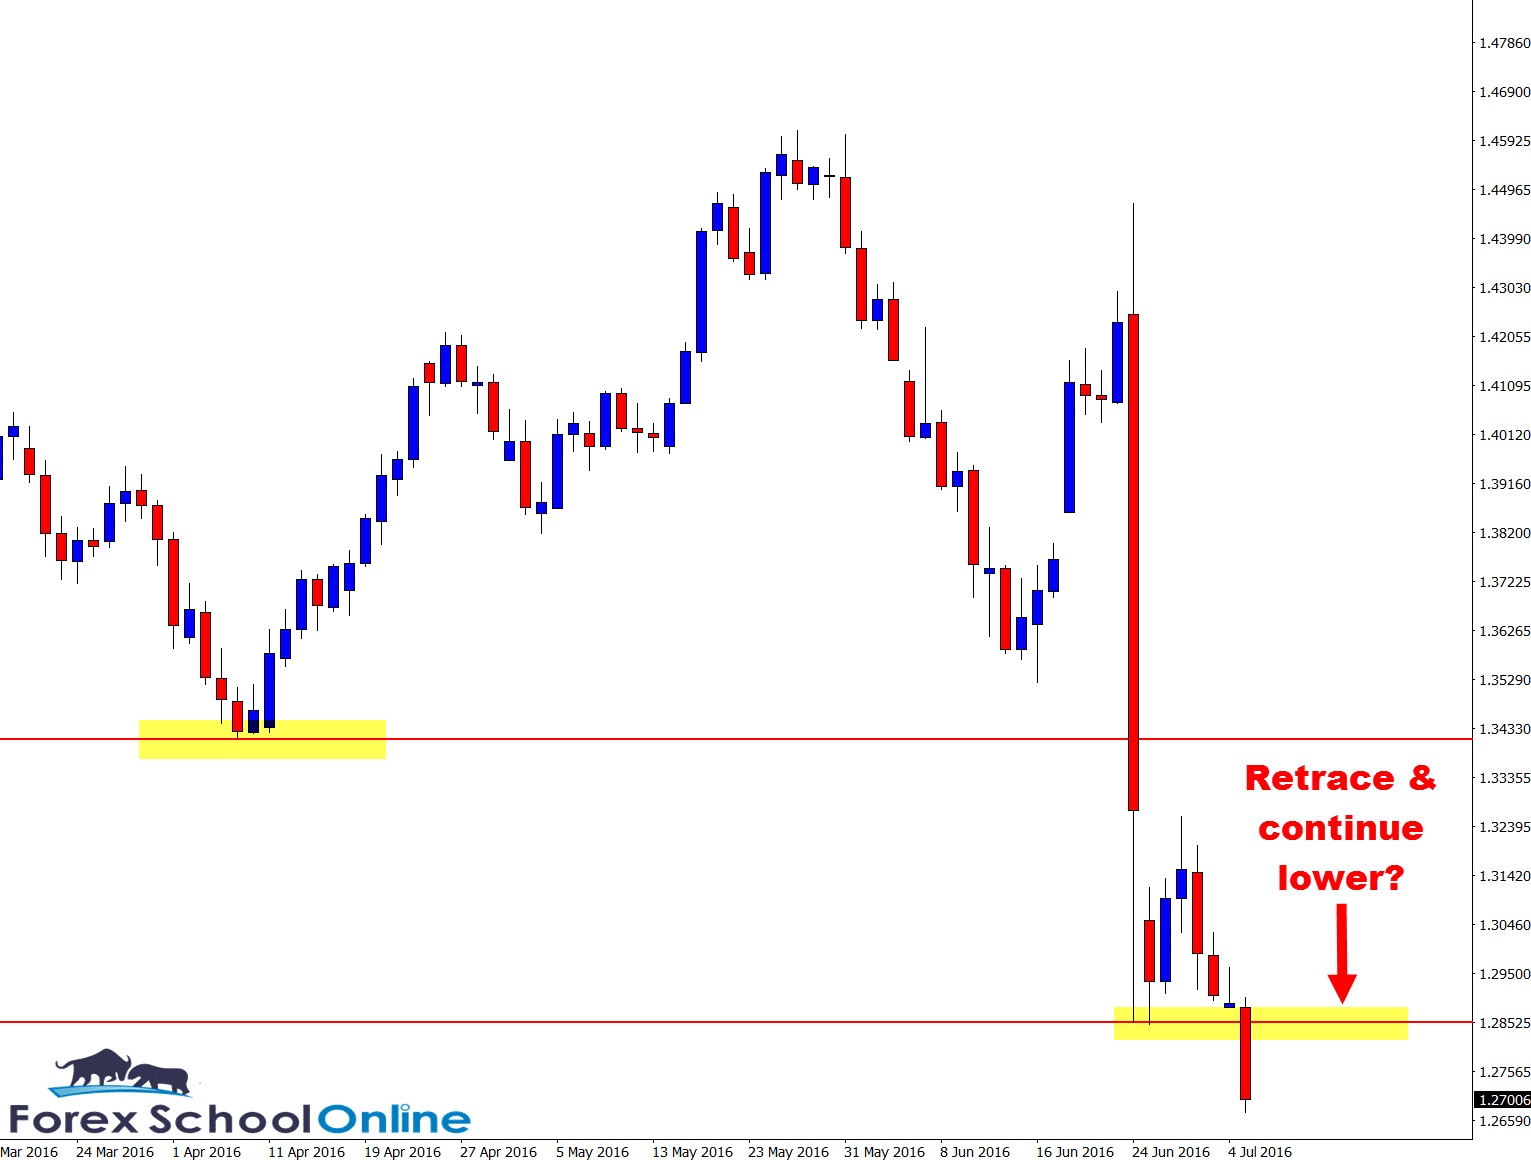
Daily Chart GBPCHF – Zoomed Out
Related Forex Trading Education


Leave a Reply