Hey guys and welcome back to Forex School Online’s Charts in Focus!
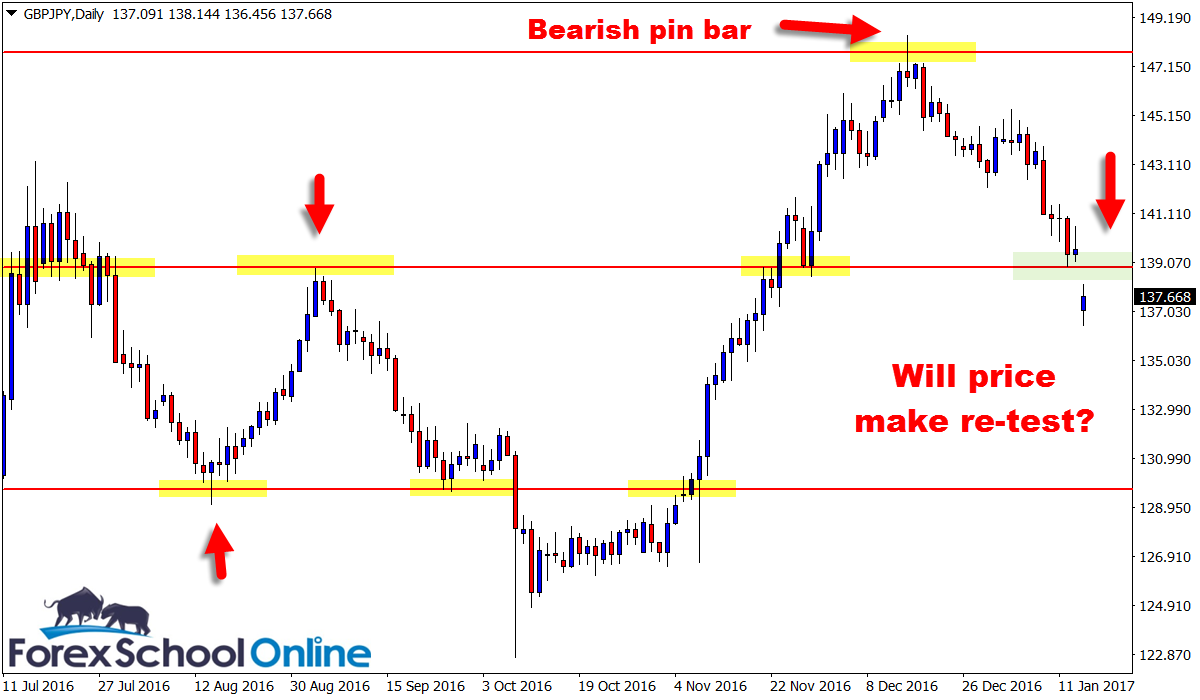
Today I am looking at the GBPJPY price action chart and in particular how price has now broken below the daily inside bar trigger, after price formed a large gap lower at the start of play on opening.
If you take a look at my daily chart below I have highlighted a bearish pin bar for you that started this move lower that formed around four weeks ago. In the weeks since this pin bar, price has formed a lower low and lower high.
If you take a look on either my chart below or your own GBPJPY Daily chart, you will note that price has also formed four inside bars in that short amount of time with this most recent inside bar being the fifth.
If you are not 100% sure about the rules on the inside bar, then you can read the tutorial here;
With price now making the break lower of the major daily resistance level, forming the lower highs and lower lows, and also making the gap lower, it provides us with the potential to look for short trades and also look at the smaller intraday charts to see what the price action story is telling us down there.
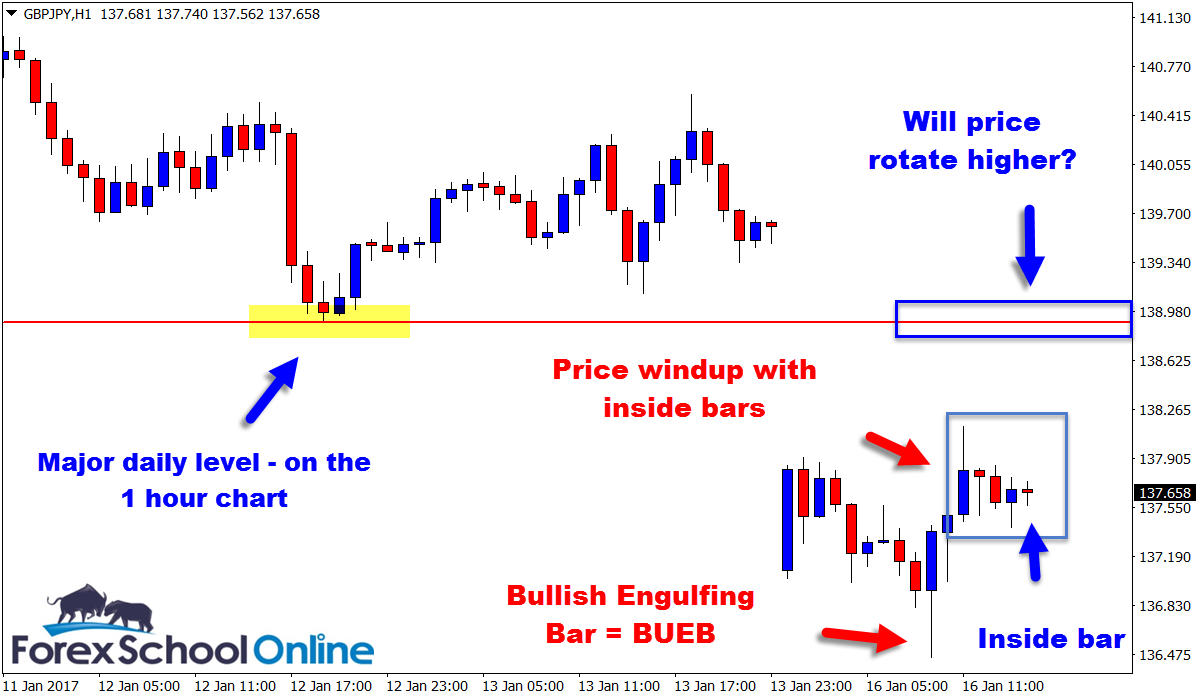
I have attached the 1 hour chart below and as you can see on that chart; the 1 hour chart is full of price action clues and information.
Price has paused and now formed a Bullish Engulfing Bar = BUEB hinting that price may pullback higher and indeed rotate back into the overhead daily price flip level.
If price does move back into the daily level we would need to see A+ price action triggers to confirm any potential trades to get short like the ones I taught in the most recent “Cherry Picking Trading Video”.
GBPJPY Daily Chart
GBPJPY 1 Hour Chart

Note: In the next two weeks I am going to be running a giveaway and I will be announcing this via email and social. If you do not want to miss this giveaway, and major lessons and announcements, then join the VIP email list by click the link below;
I Want to Be on the FREEBIE VIP Email List!


Leave a Reply