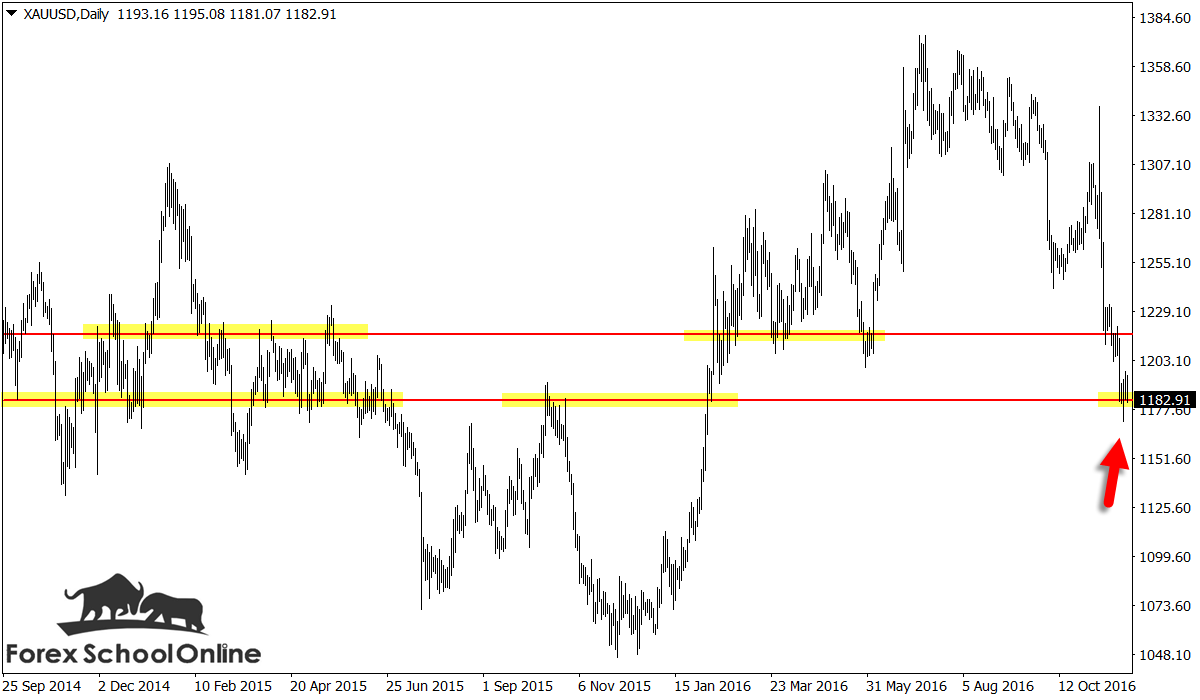
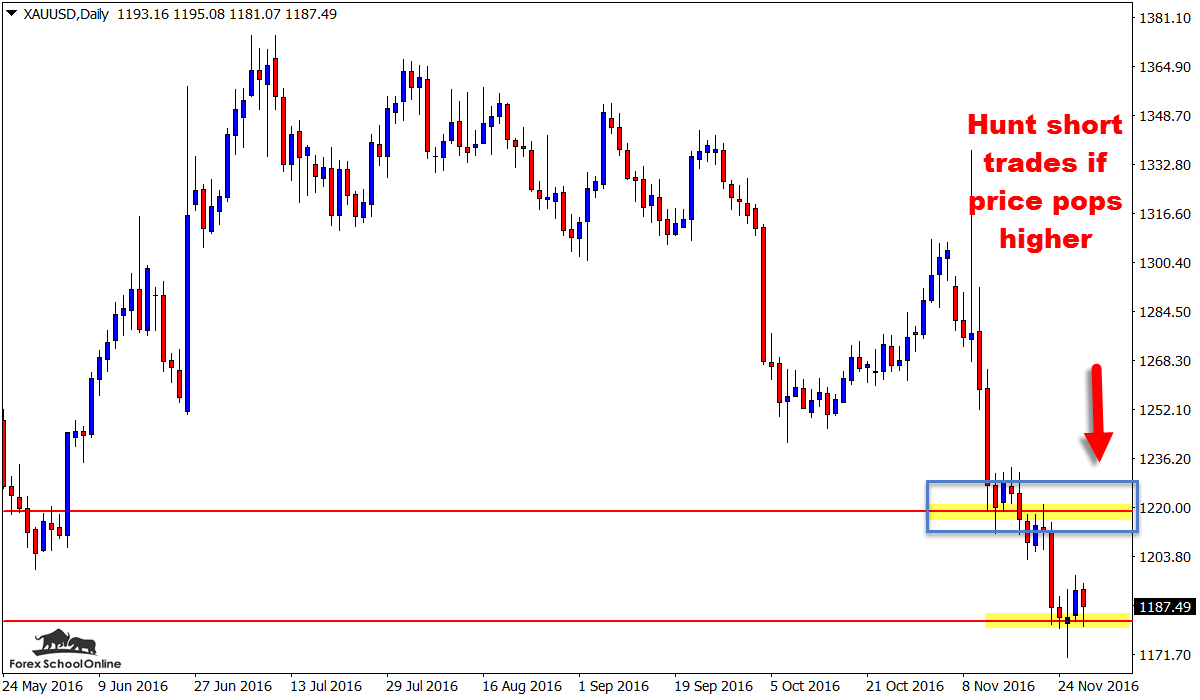
Price is attempting to push off a major daily support level after it has just formed a bullish rejection candle on the daily price action chart of the Gold v USD market.
As I write up this summary and price action analysis; price action is attempting to make a rejection of this major daily support level.
Price on the daily chart is in an overall sideways market, but the momentum in the very short-term has been all lower and it is this momentum that we would be taking trades with and it is this momentum that we want on our side when entering price action trade setups.
When looking for a pull-back or quick retrace, this momentum can be a huge help and a huge tick in our favor. The trend is something you always want to be looking for and something you want to be analyzing as part of putting together your price action story.
If you want to learn how to trade with the price action trend, jump over to the lesson here; How to Trend Trade Price Action | Tutorial
Just like a big puzzle, we need to be always thinking ahead and always putting things together. Not just 1,2 and done!
If price can make a move back higher, this market has a level overhead that is a major price flip resistance level. This level has acted in the past as a major proven resistance and support level. If you have a look at the 4 hour intraday chart below; it shows you in detail how this price flip is in effect on this pair.
The lesson How to Make High Probability Trades at Price Flip Support / Resistance Levels discusses how to find and use price flip levels in your trading and then also hunt high probability price action trades at them.
If price can make a retrace back into this price flip resistance we could watch for potential bearish short price action trade setups. For any trade setups to be confirmed we would need to see an A+ trigger signal at the price flip level like the ones taught in the Forex School Online Price Action Courses.
Daily Gold Chart
Daily Gold Chart

4 Hour Gold Chart

Related Forex Trading Education


Leave a Reply