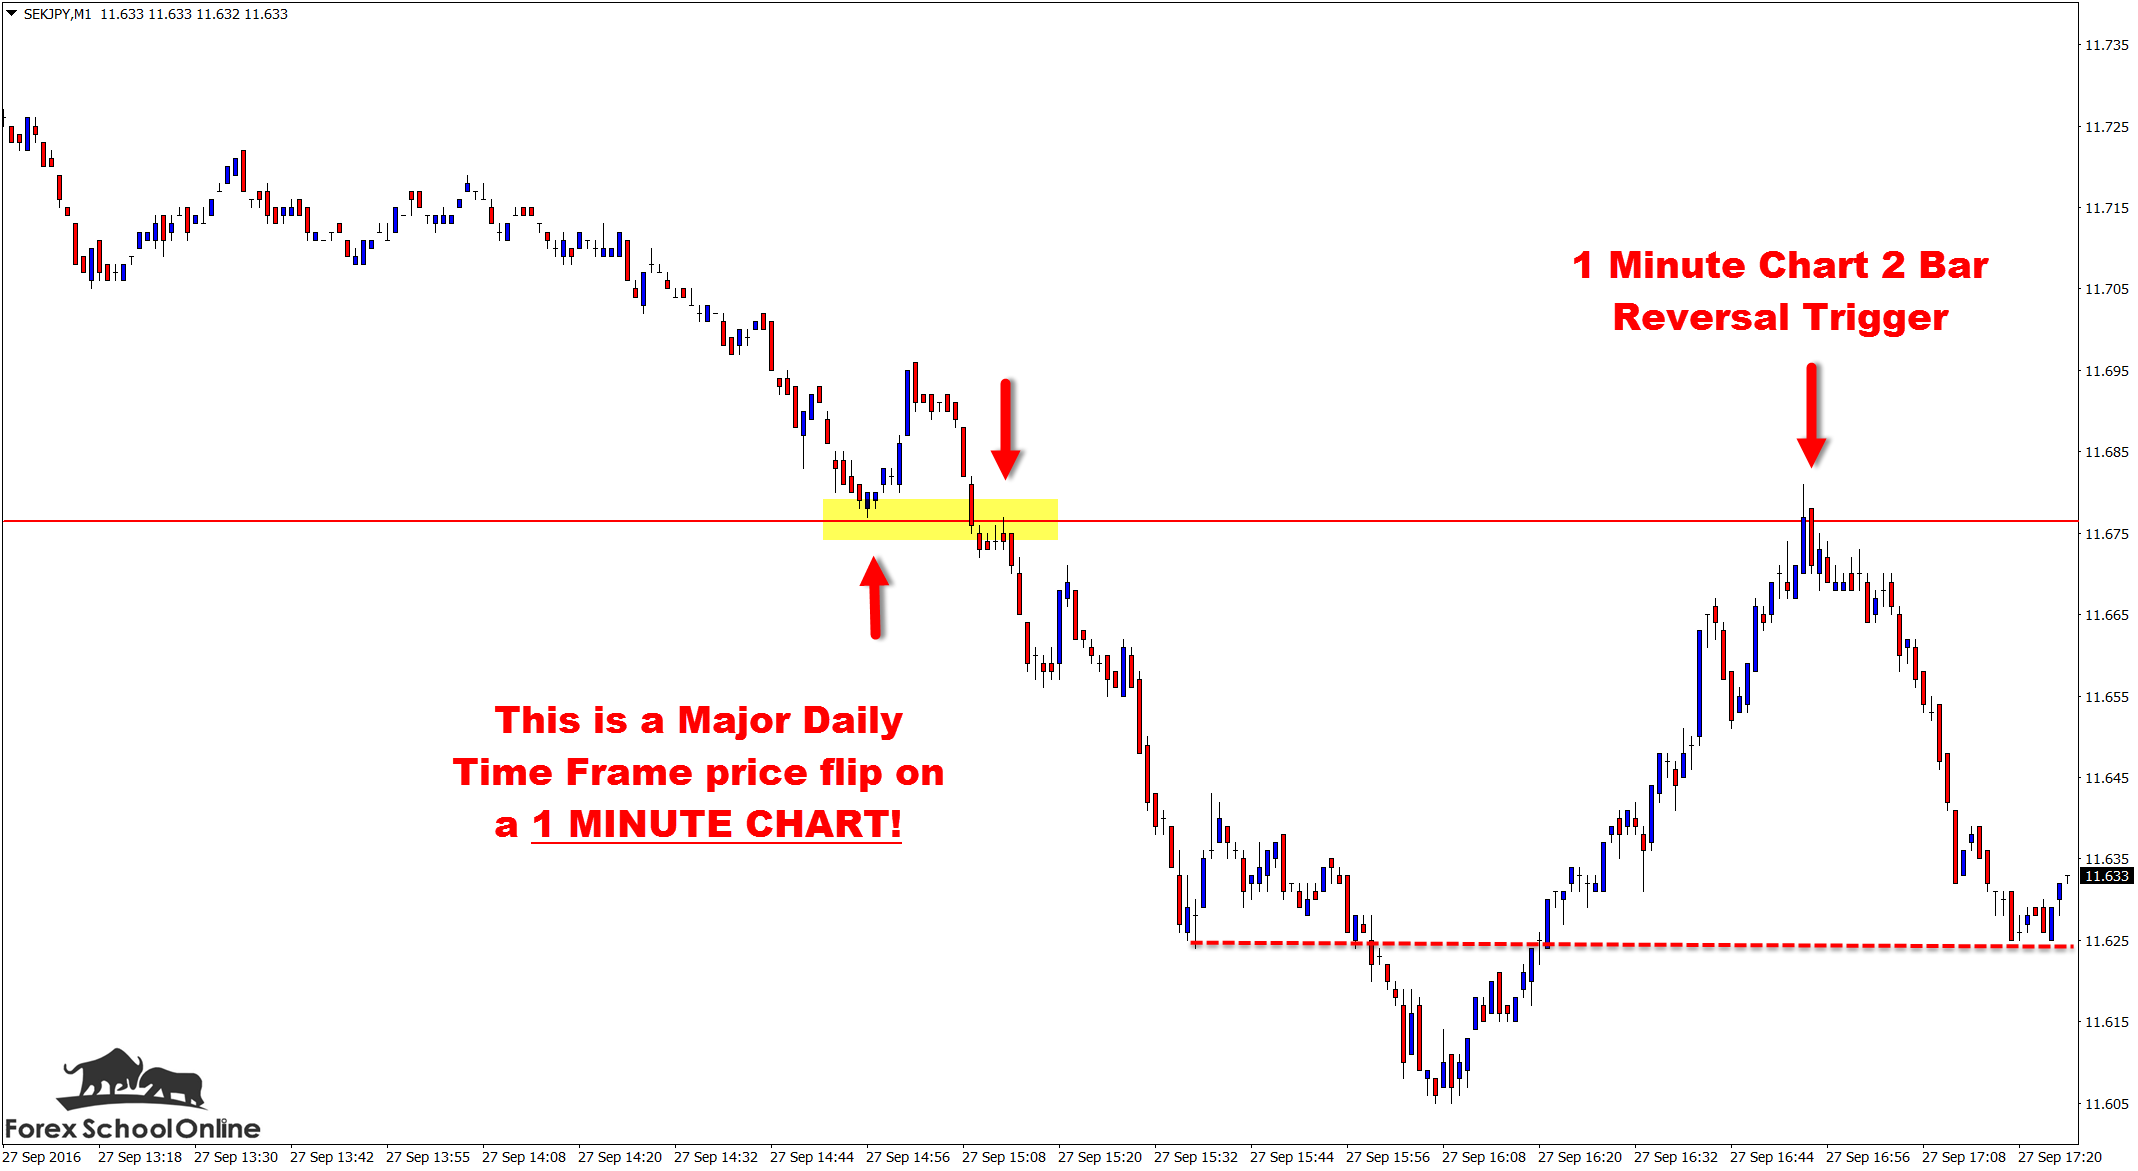
Price has now moved lower and back into the swing lows on the 1 minute chart after firing off what was a pretty solid 2 bar reversal, all things being considered.
I have included three charts below which I will go through in-depth for you to explain the price action story. But before I go into that further there is something I want to discuss, something about which I am constantly emailed and sent comments with questions: time frames.
I highly recommend you start your trading on higher time frames like the daily and 4 hour charts – in fact I recommend you concentrate on one of them. I also do not advise moving lower to smaller charts until you have earned the right. What do I mean? Once profitable on the higher time frame, you can then move to the next smaller chart and the next smaller chart and move to as low as you would like.
I discuss why I recommend this method and how to implement it into your trading in the lesson at: Trading the Daily Charts Down to the Intraday Chart With Profits All the Way!
Once you become profitable you can then start moving to the time frames of your choice. This one-step-at-a-time approach will keep you from falling into the trap of over-trading and will help you understand the really key lessons that need to be learned early on. These are lessons like discipline and how to first find high probability trades within a really solid market, and then knowing how to manage them.
I do not recommend ever moving below the 15 minute chart. That is as low as I personally trade myself. Price action is price action and it can be read and traded if you understand the clues, which is why I am posting today’s 1 minute chart.
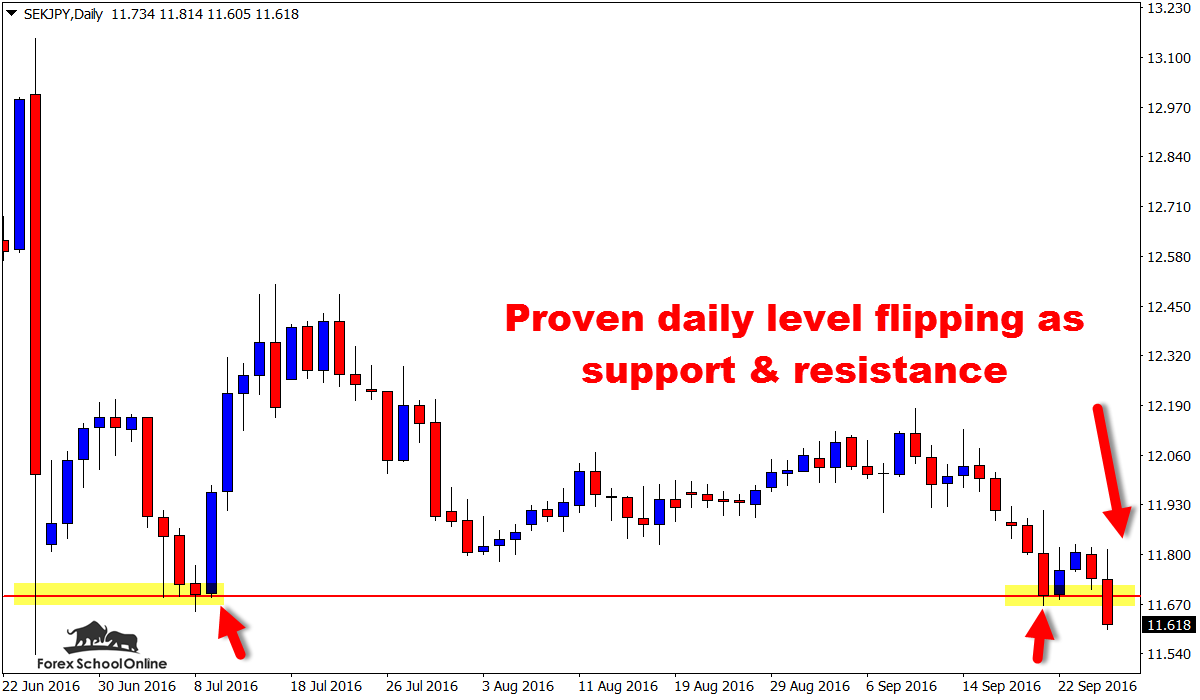
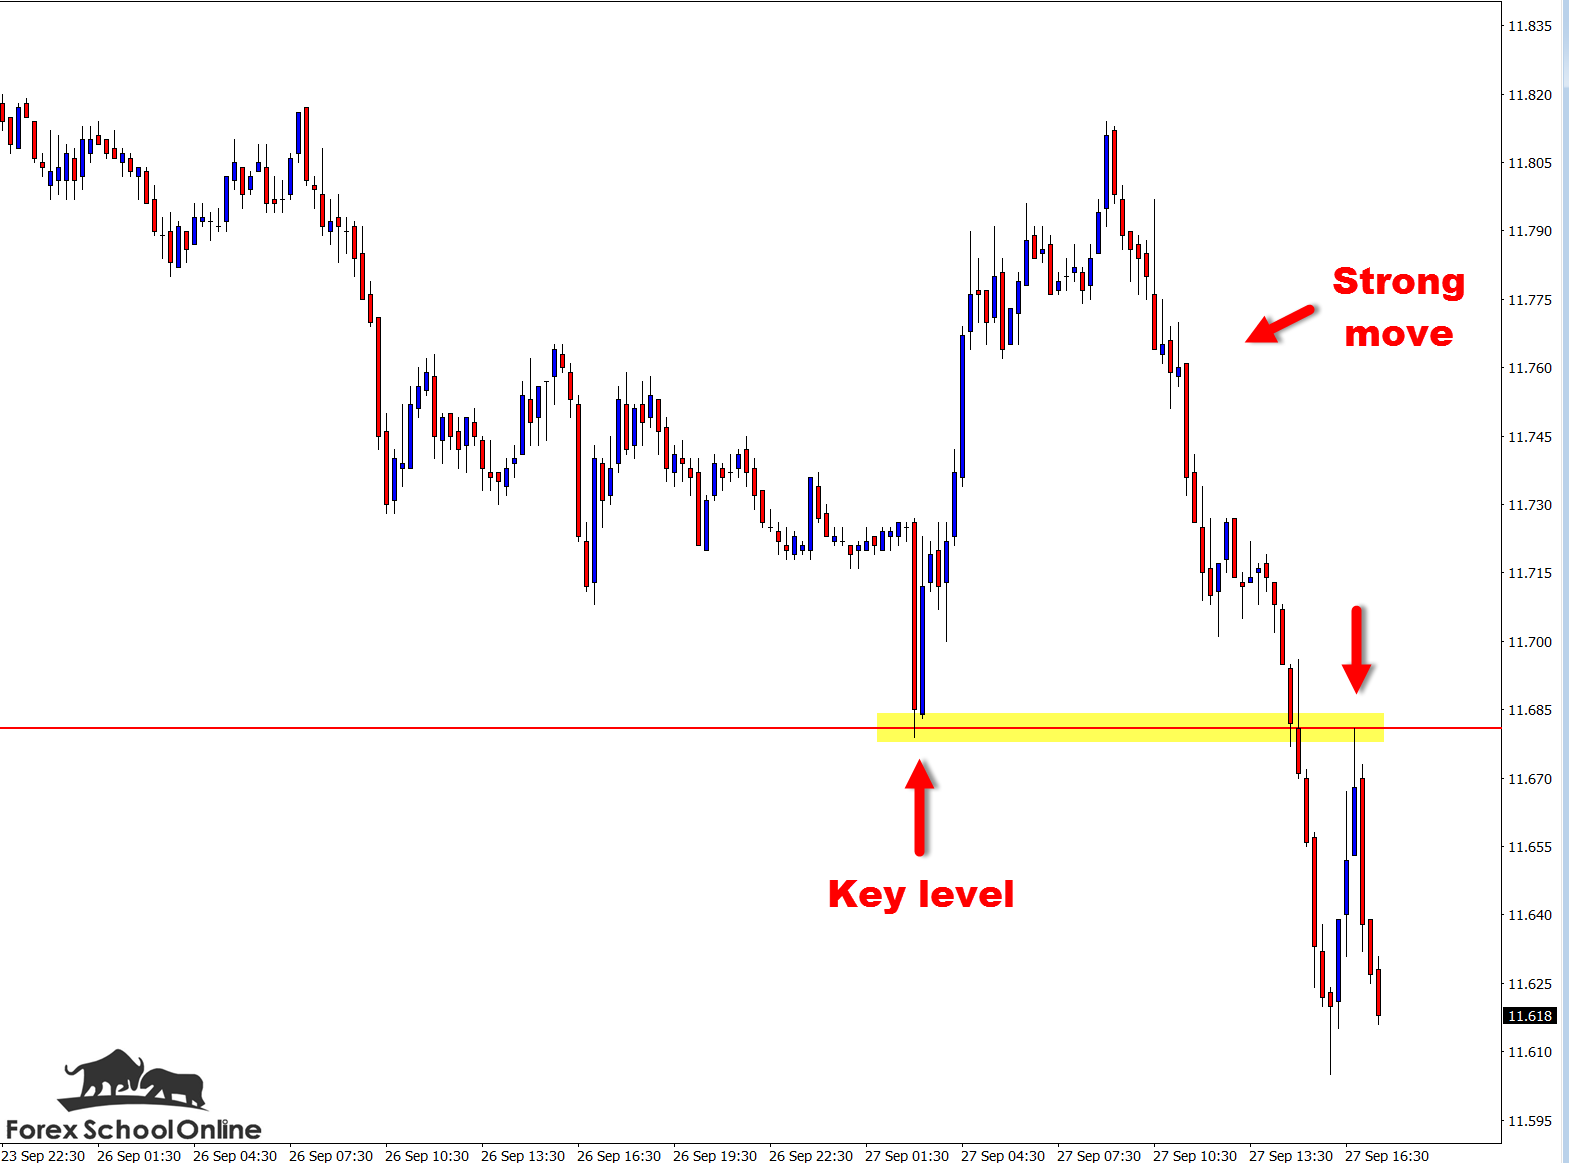
I am more interested to show you how even on a 1 minute chart we can still read price action order flow. We can still see this pushing & pulling of the price action and what is so, so crucial – after marking our daily price flip support / resistance level it is still being respected and no matter how low we move we can still hunt trades on it.
That is why we mark our levels on the daily chart because no matter how small the time frame we move to, we always know >> that level we are hunting a trade at is a major level and not a flimsy one.
A really important lesson I wrote on this that I can not recommend highly enough that covers not only how to mark daily levels and hunt trades at them, but also the routine to use, and how to save yourself a lot of hours out of your trading week can be read at:
The Ultimate Guide to Marking Your Price Action Support & Resistance Levels & Price Flips!
Daily SEKJPY Chart

15 Minute SEKJPY Chart
1 Minute SEKJPY Chart

Related Forex Trading Education


Leave a Reply