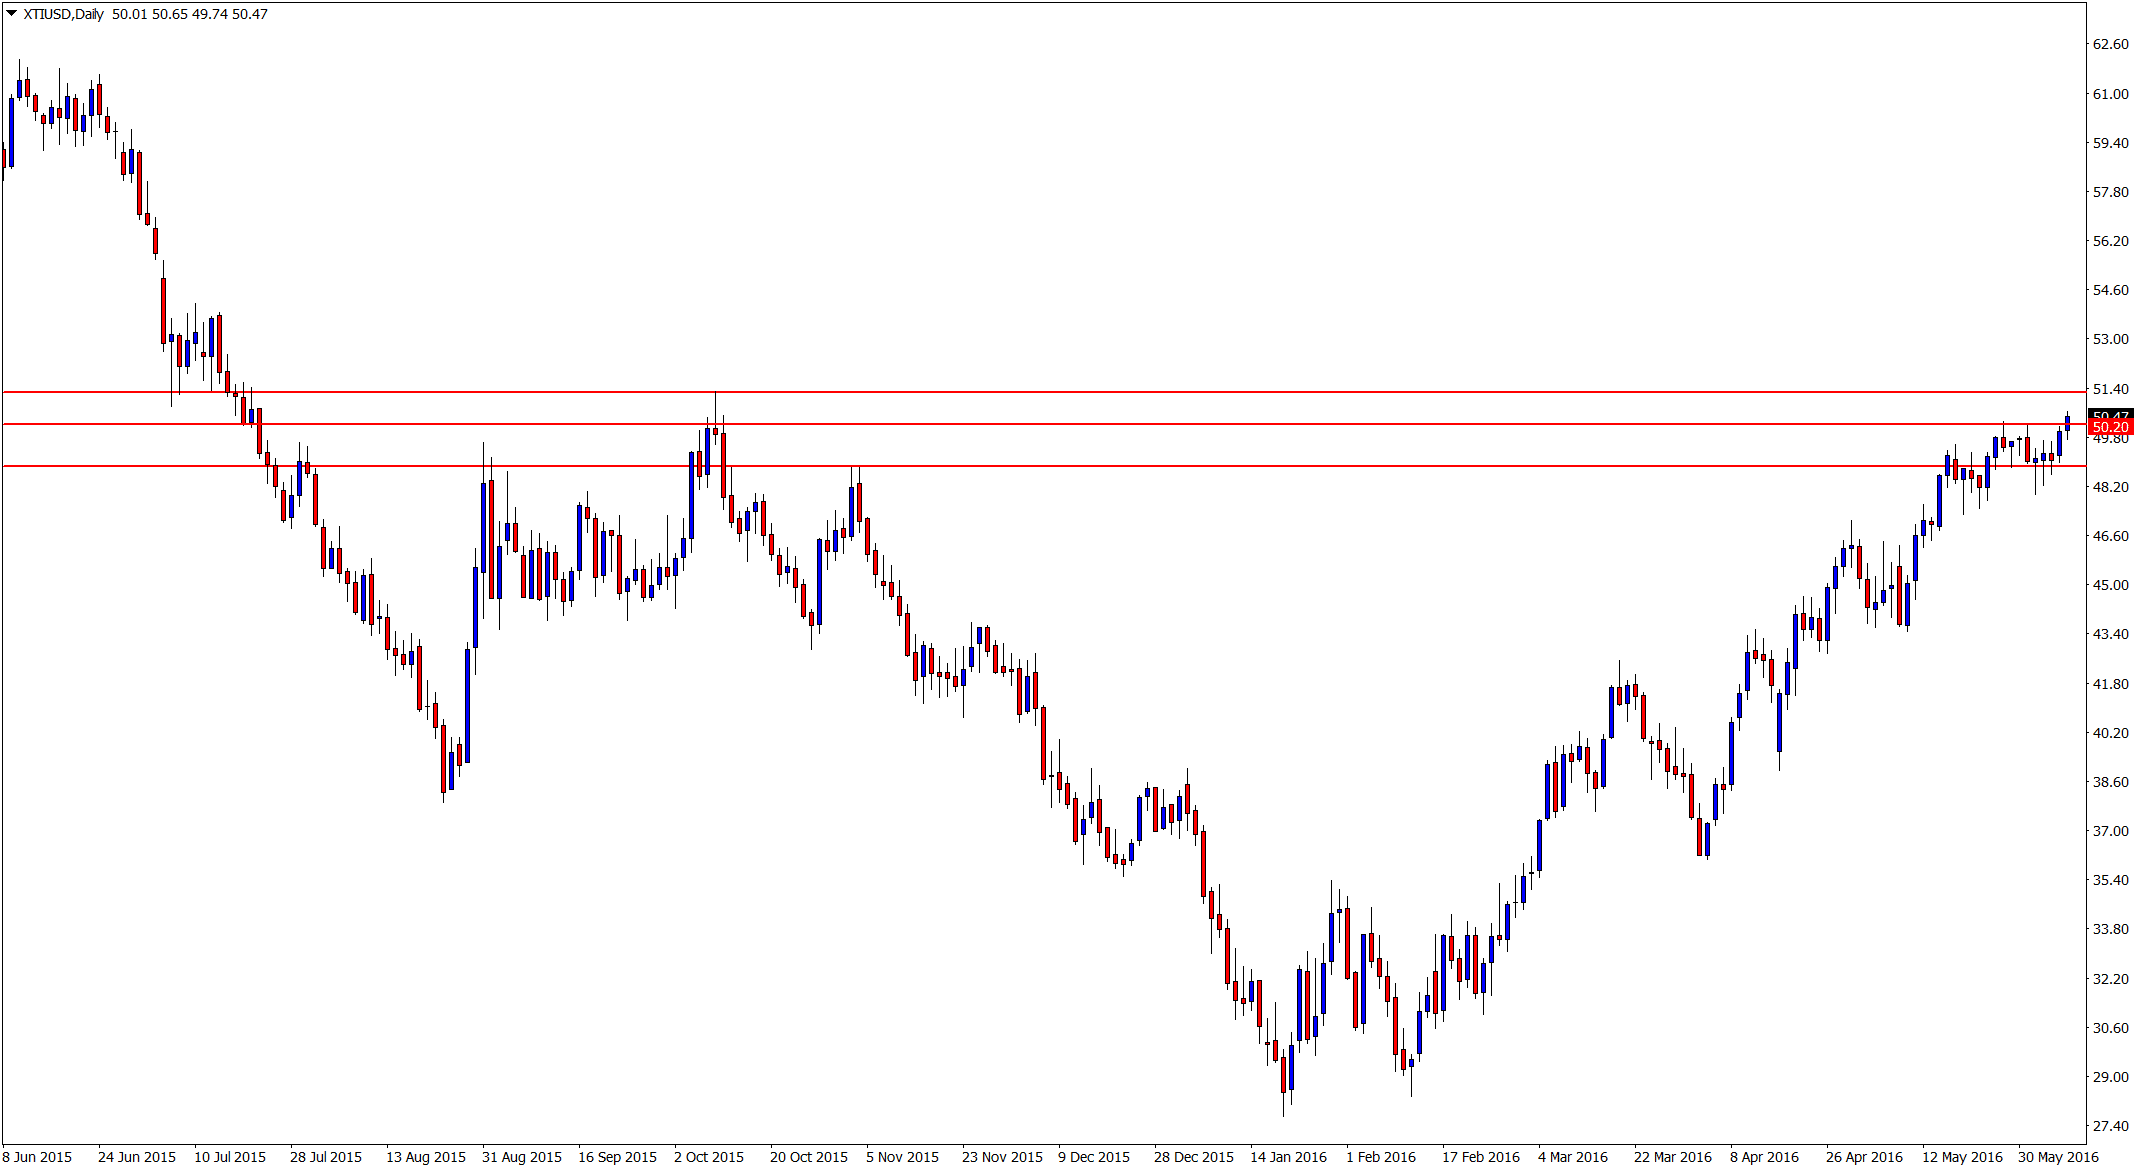
As I write this ‘Charts in Focus Daily Summary‘ for you, price in the Oil v USD market is attempting to breakout higher and through a major daily resistance level.
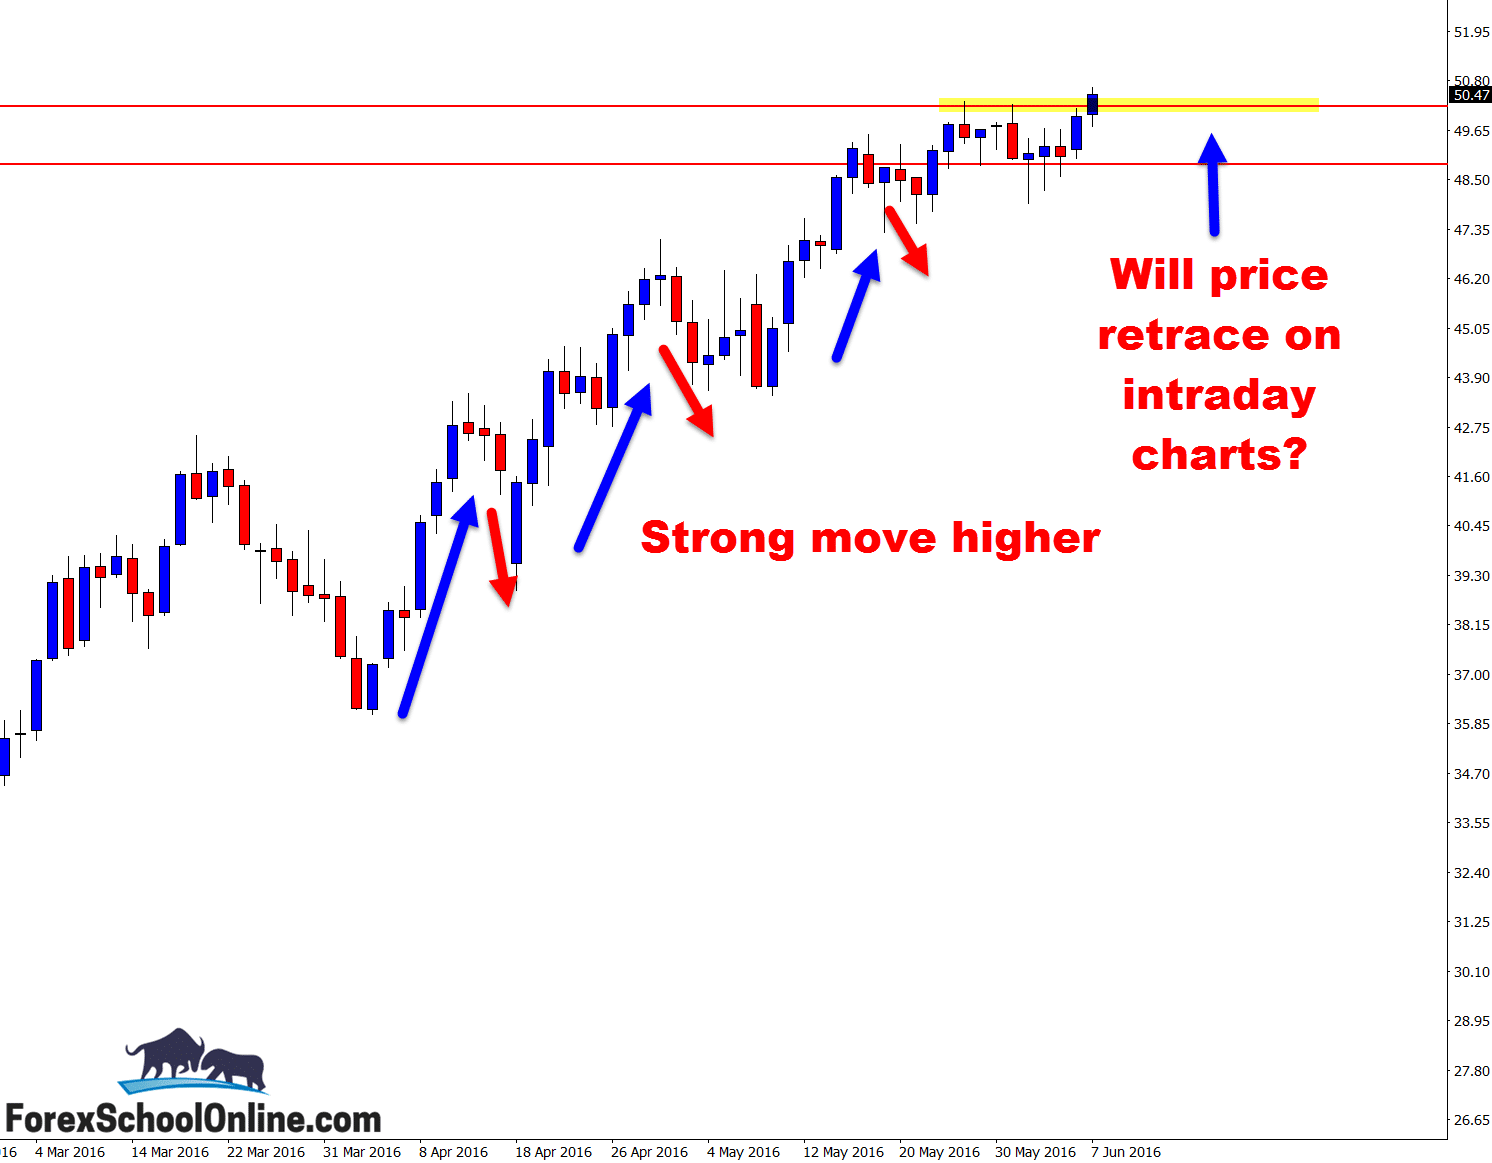
Price on the daily chart has been moving higher, creating a strong momentum and fresh upward trend. As my daily chart illustrates for you below, since the beginning of February of this year price has created a base low and has ever since been creating higher highs and higher lows. This is a really solid trend upwards.
The best way to trade these markets is always with the trend, i.e. using the trend as your friend. With that in mind, breakouts have a stronger chance if the trend is in line with the breakout direction – like it is in this case.
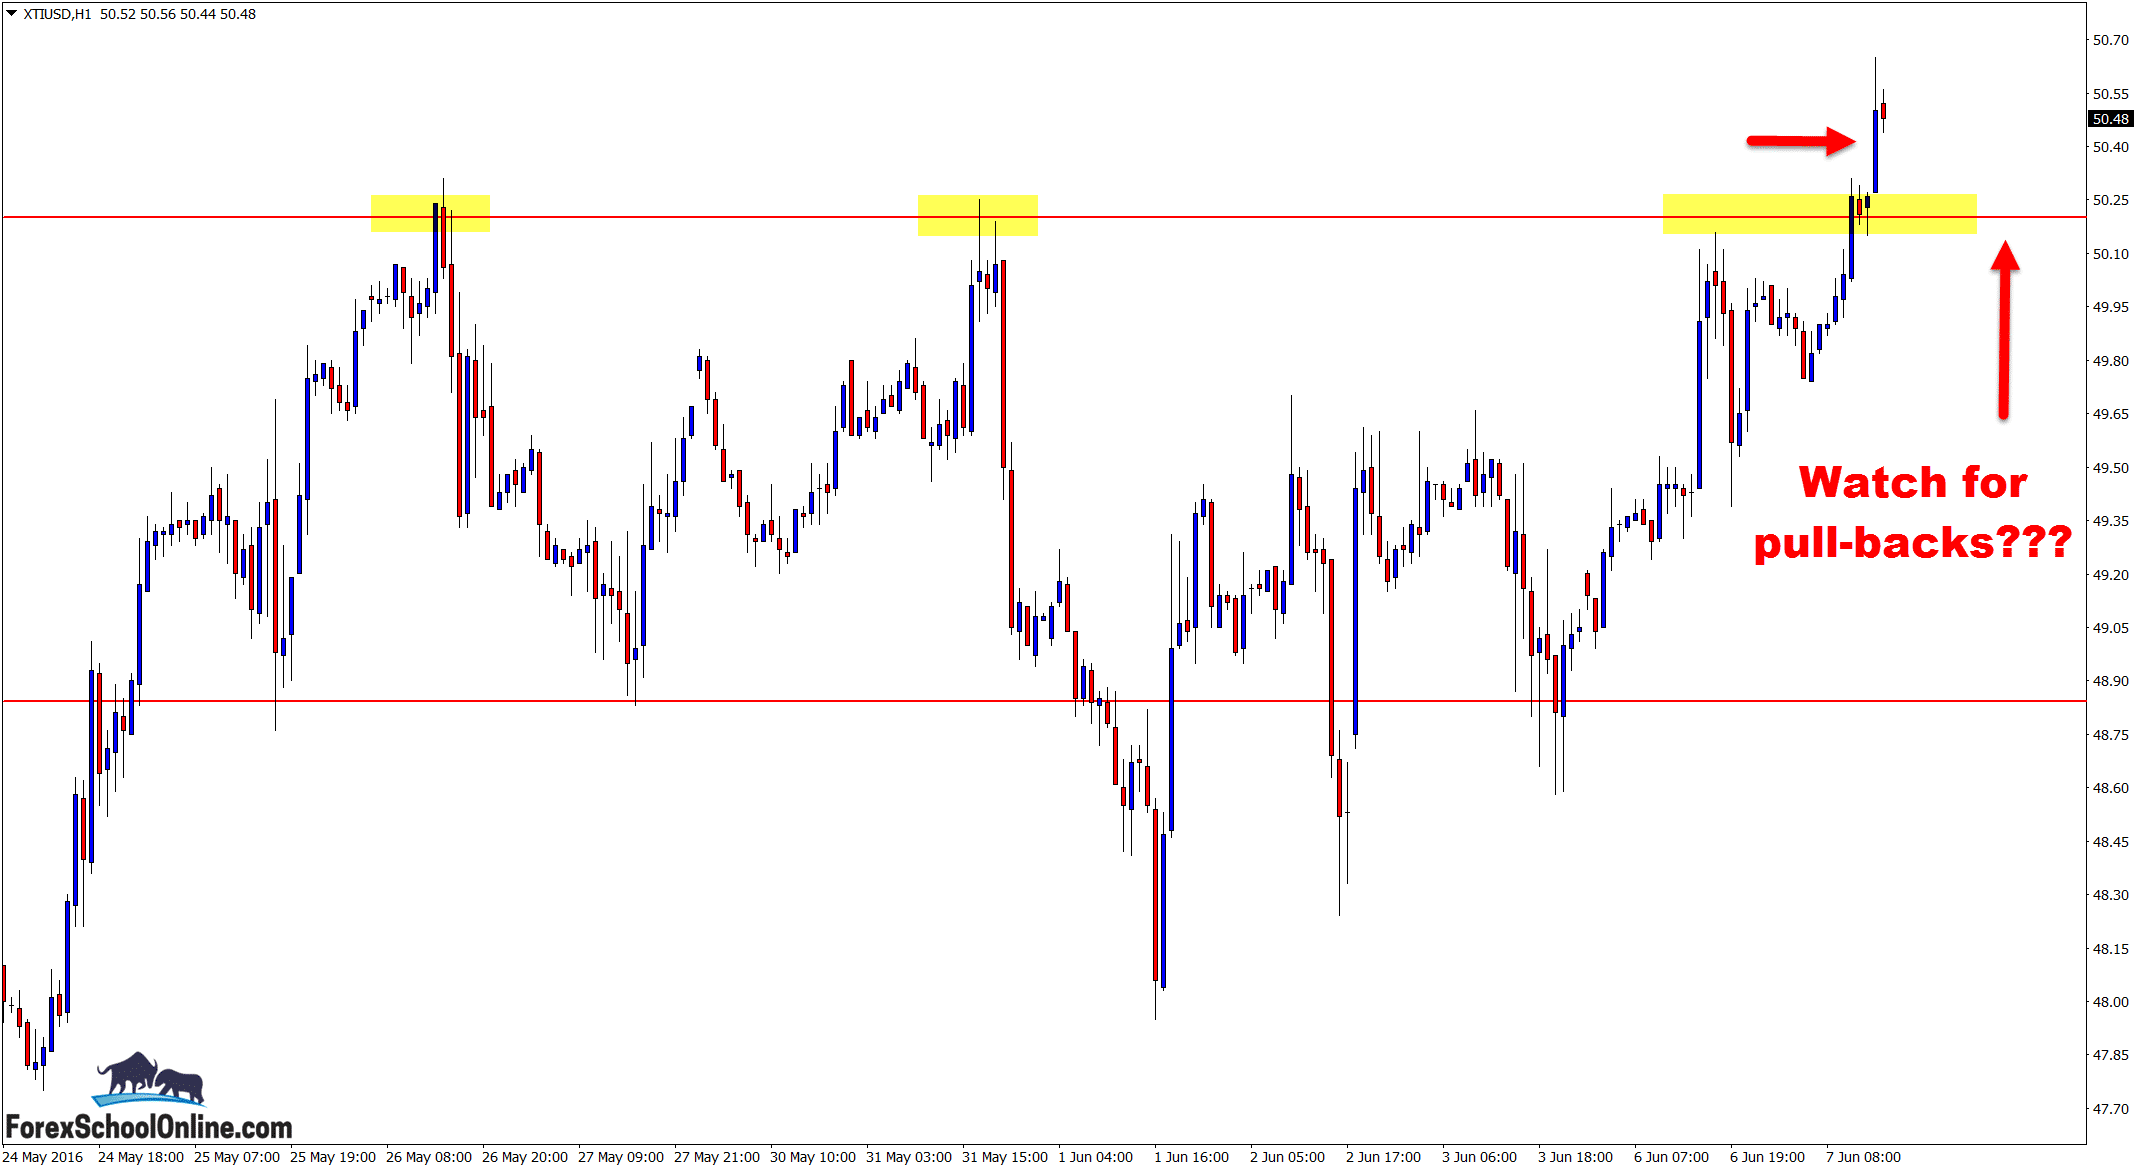
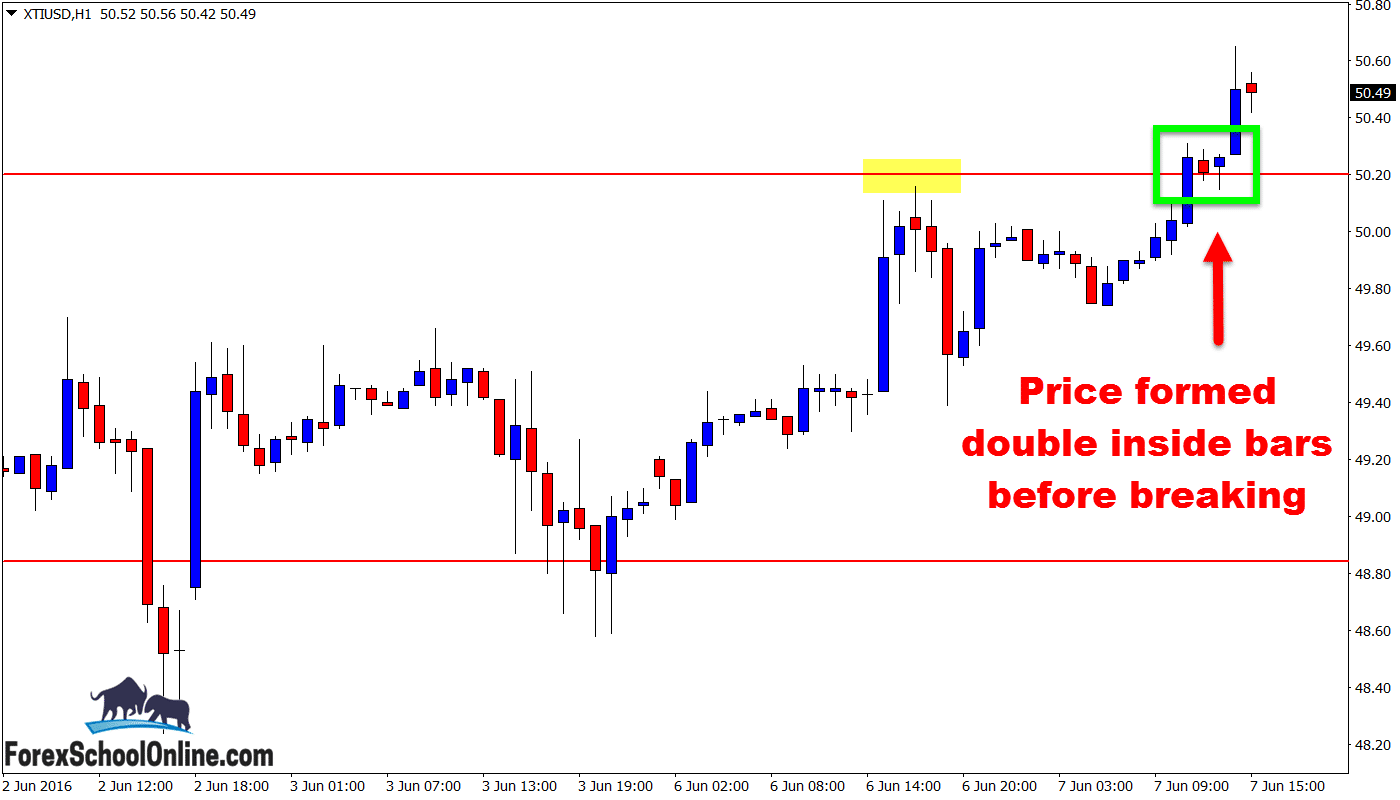
If we move to the smaller intra-day charts and start to investigate what we may look to do or hunt for possibilities, we can see that on the 1 hour time frame, price action stalled and formed back-to-back inside bars just at this major resistance level. This happened right before busting higher and breaking out.
This could be a really interesting and high probability area to watch on our intraday charts moving forward. As you can see on my charts, this trend and momentum is upward, and with the breakout on the 1 hour chart the momentum on the 1 hour chart is also upward.
If we are to now look for price to make a quick pull-back or retrace into this old resistance and potential new price flip support (and possibly hunt for high probability long trade setups), not only would we be trading with the momentum and trend, but we would also be trading at a major daily key level.
There are other boxes we would need to tick such as making sure we have a high probability trigger signal to confirm the trade and making sure we have space to trade into so we can safely manage the trade accordingly to our trade management plan. You would need to tick these off in your Trade Checklist. If you don’t have one yet, then make sure you create one now here;
➜ Create Your Forex Trade Checklist
Daily Oil Chart

Daily Oil Chart

1 Hour Oil Chart

1 hour Oil Chart

Side Note: I just want to make a quick note to all the regular followers of this blog who follow the setups in here. I normally post at least 3 setups at least a week during the US trading session. Over last week or so not much was posted and wanted to let those know who have sent in emails that I was just sick and not feeling well, but all back to normal and up and running now!
Related Forex Trading Education
➜ Create Your Forex Trade Checklist


Leave a Reply