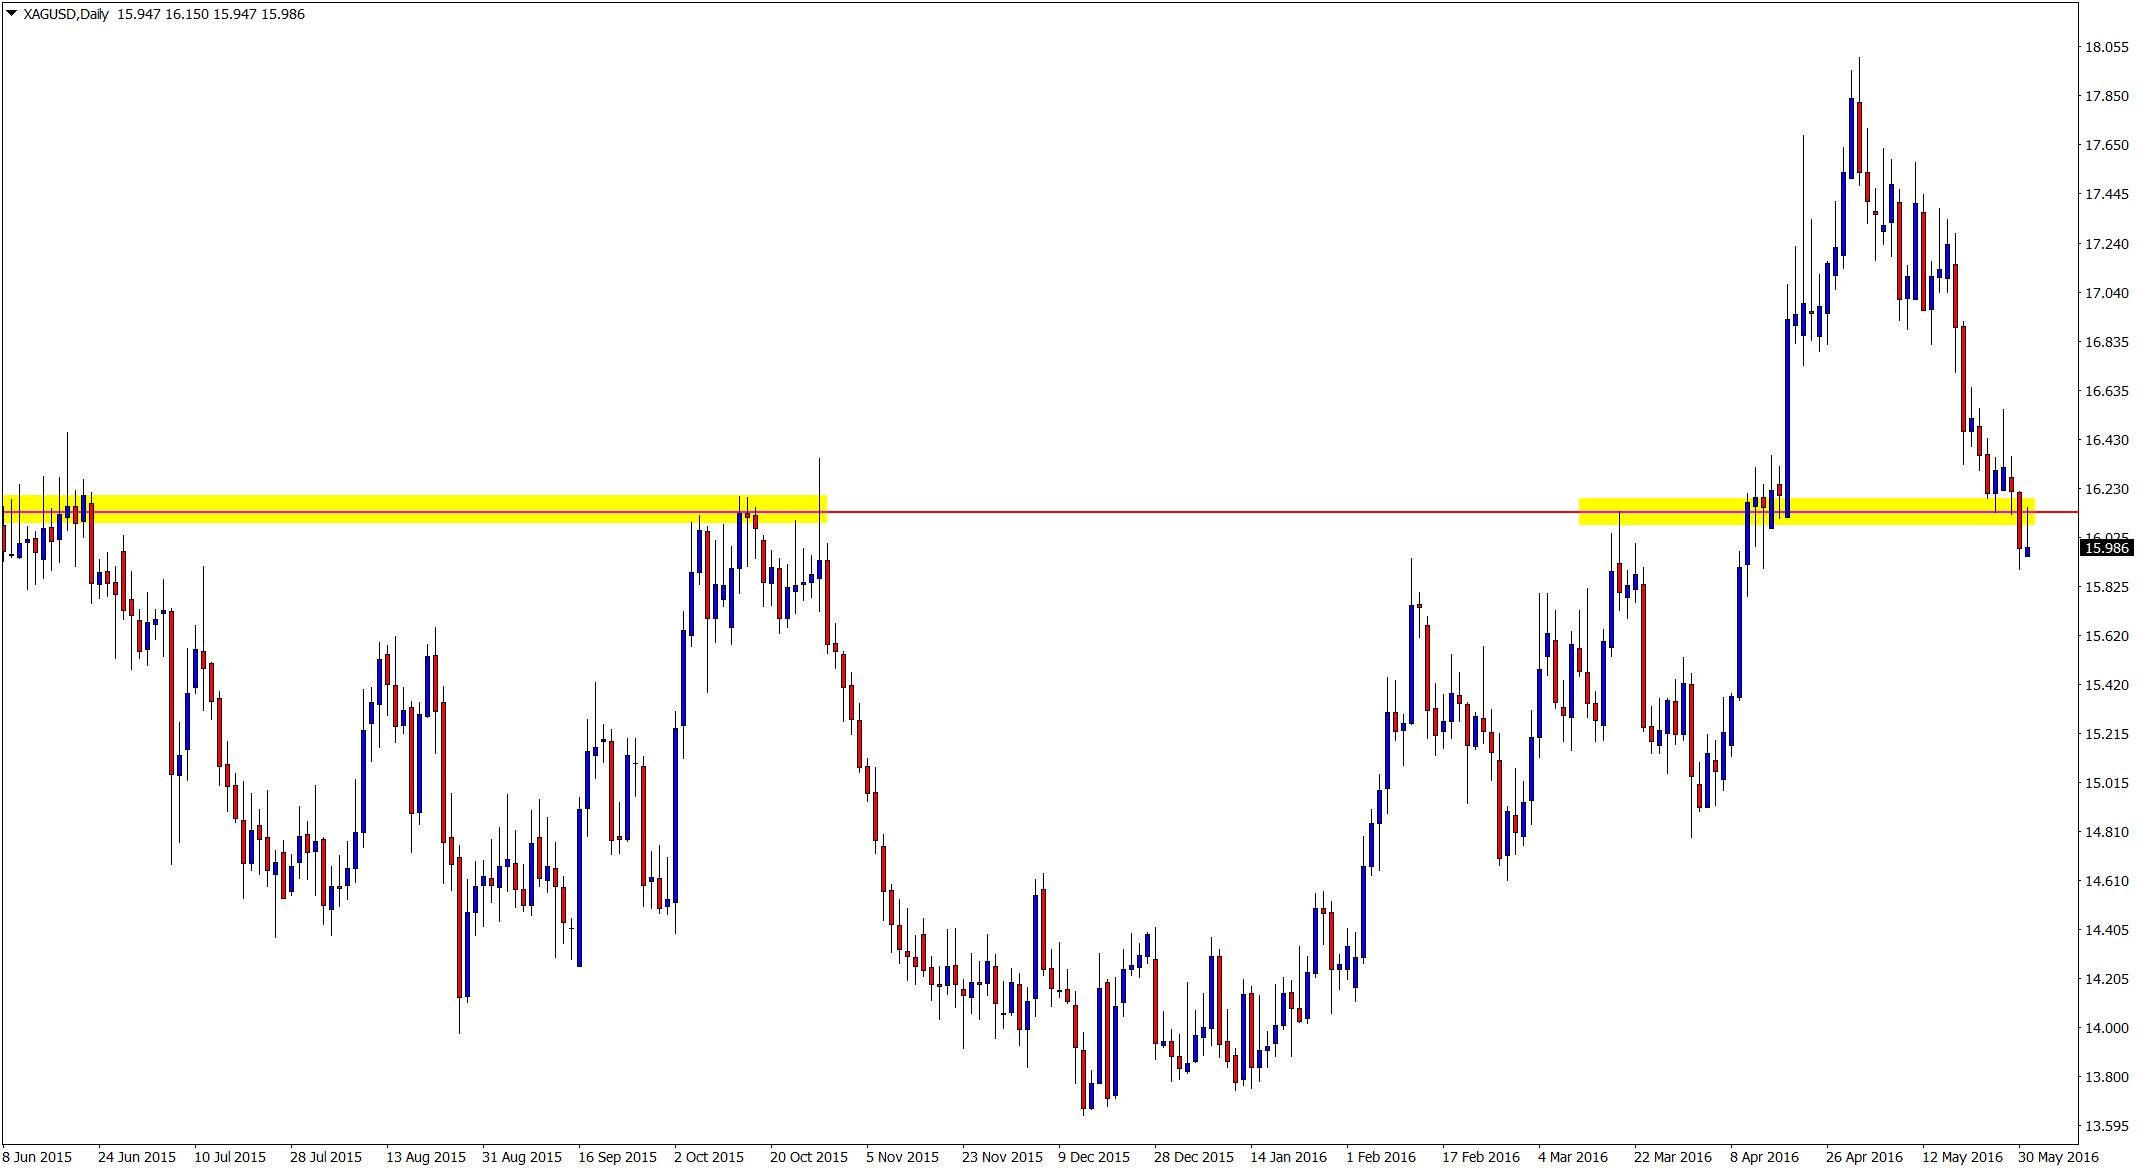
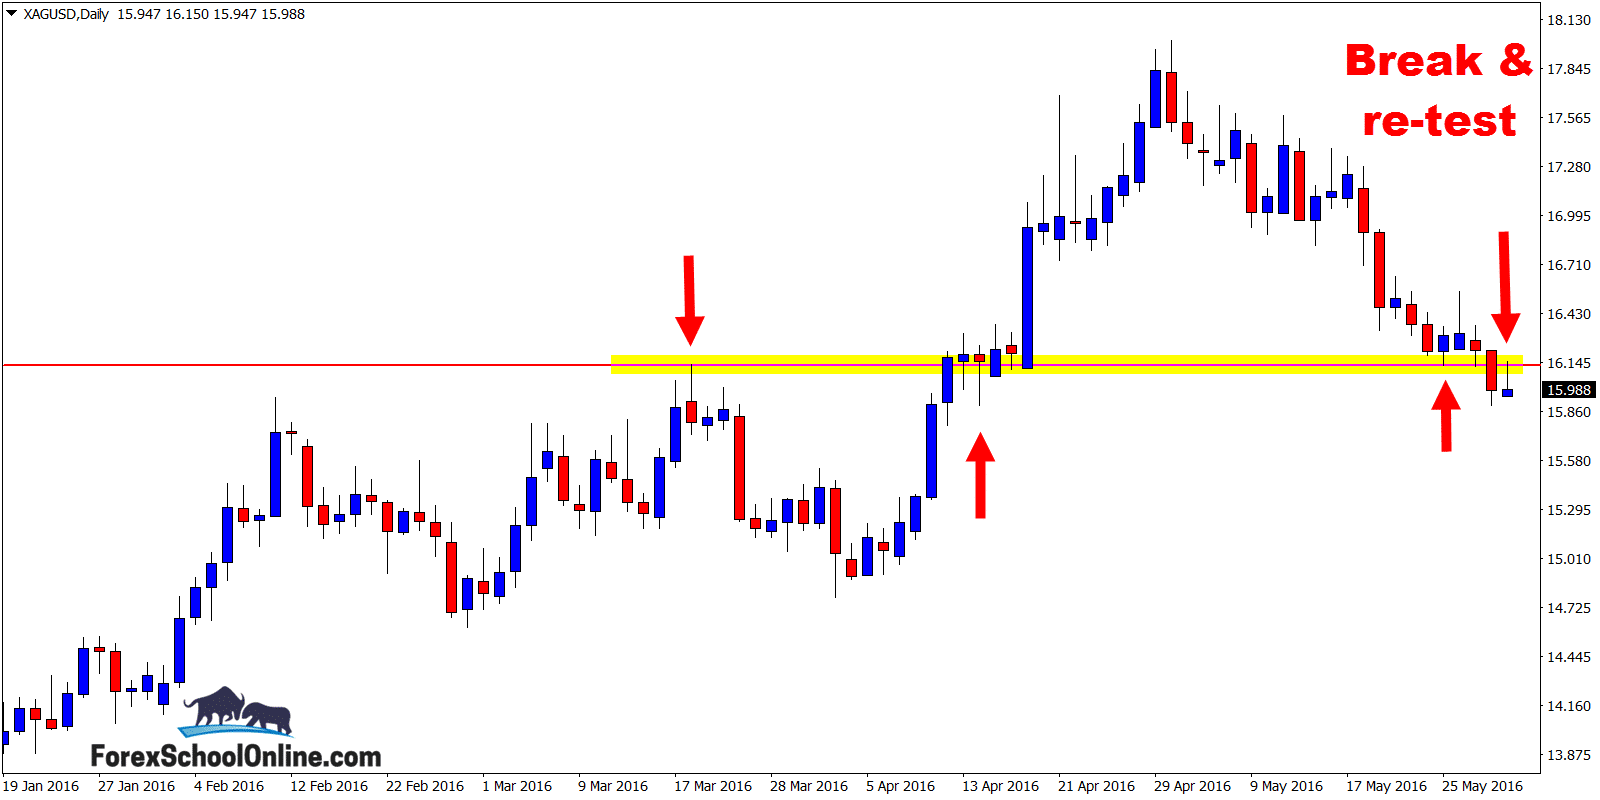
On the daily price action chart of the Silver market, price has made a quick re-trace and re-test of the old support and new resistance price flip. This comes after price broke lower and closed below after yesterday’s session.
This is a high probability price action pattern that we discuss regularly. If you are not already aware of it or don’t understand how to trade it, I recommend you quickly get up to speed by going to this lesson:
How to Make High Probability Trade Setups at The First Test of Support or Resistance
We can often make the best trades when price makes the first test back into the major level. That is not by any means to say that we have to ONLY make trades from the first test of a level, but when price makes a first re-test of a level it is often the strongest rejection.
An example of this on the Silver market is after price broke and closed lower on the daily chart, it then started a retrace back higher into the price flip level. Price was looking to re-test the old support and new resistance level that it had just broken out of.
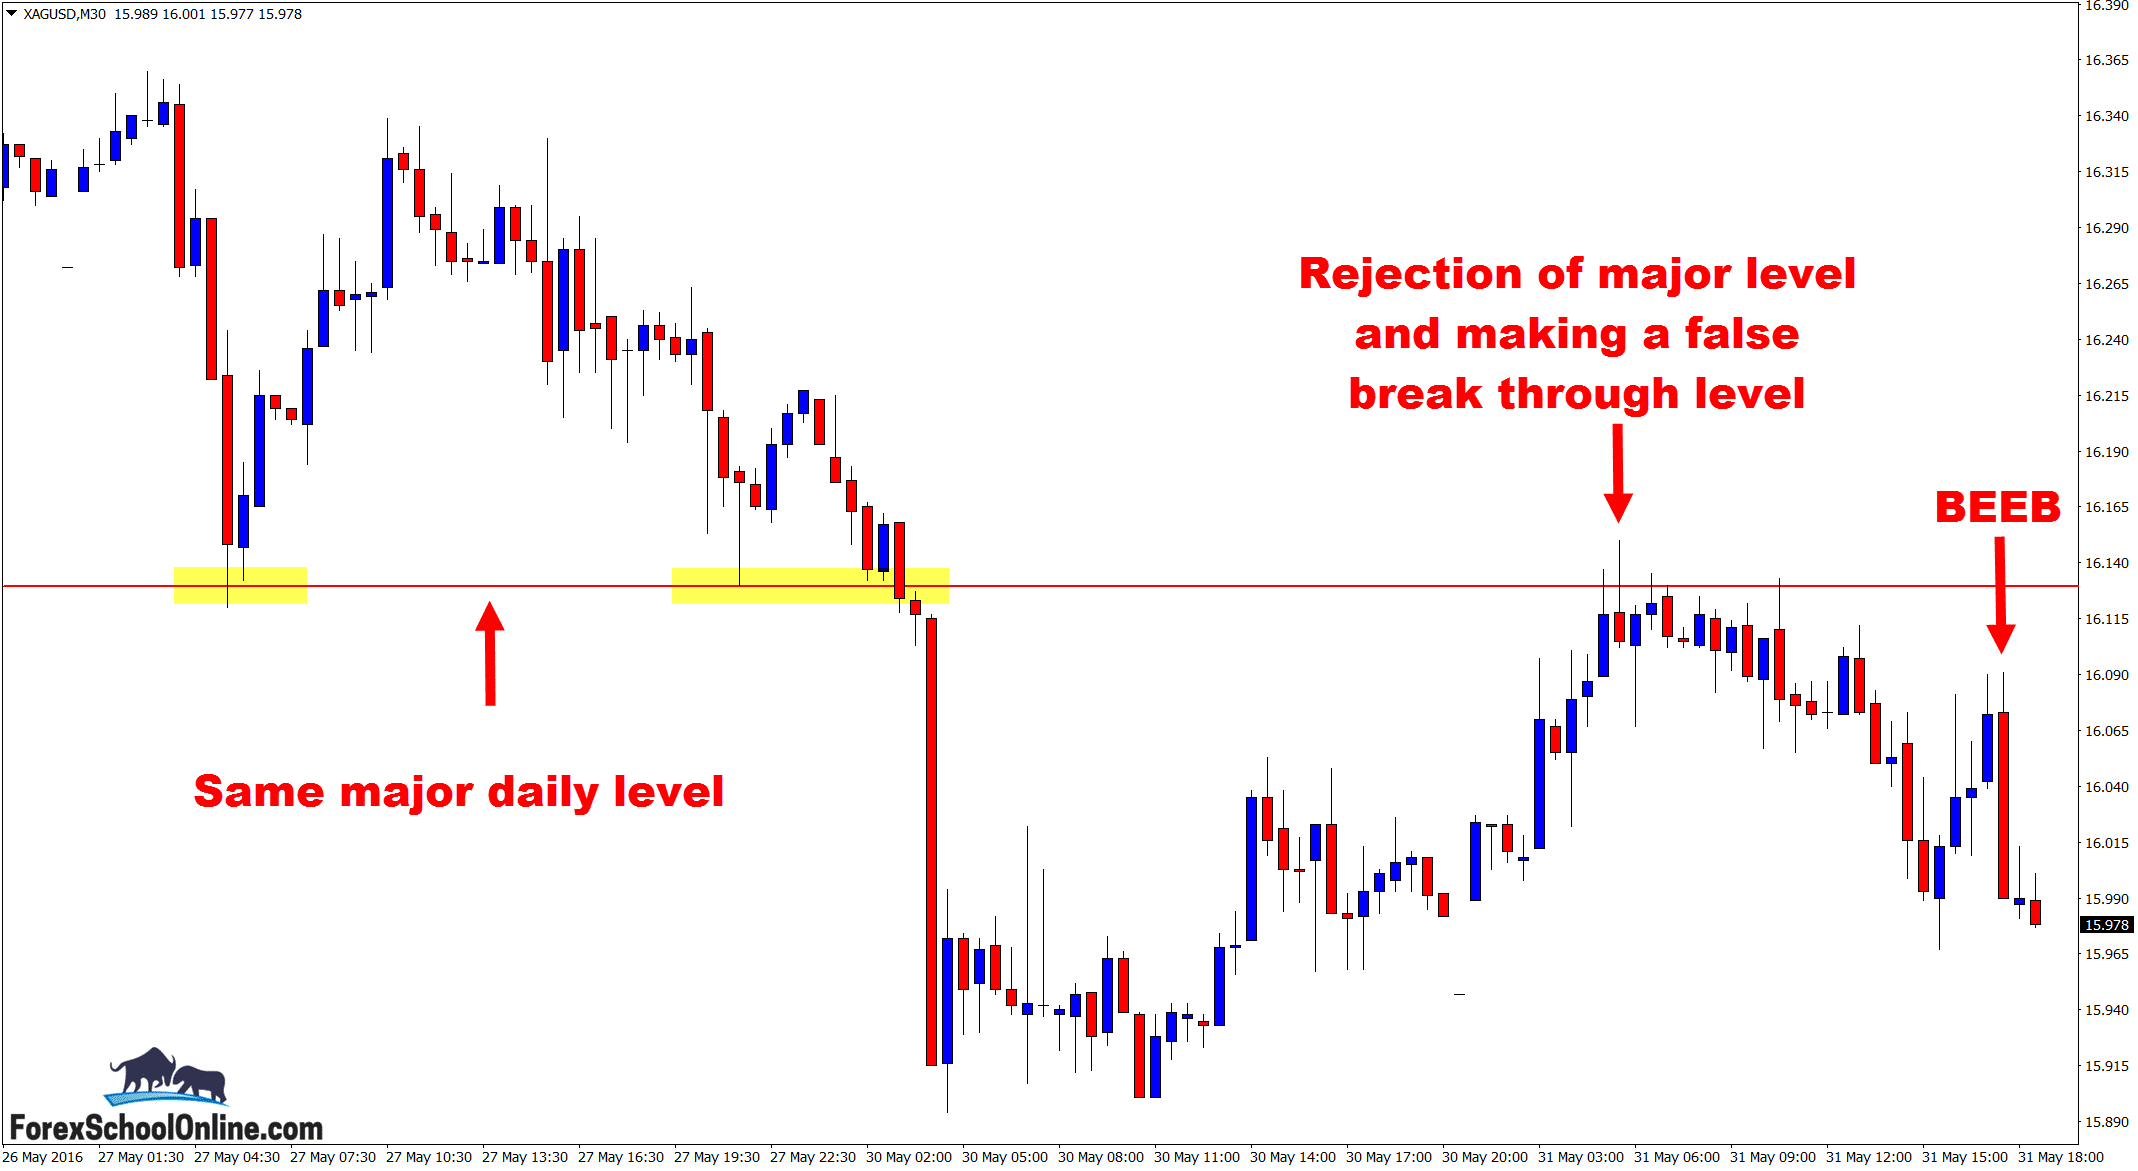
If you look at my 30-minute intraday chart (attached below), you will see that the first time price made a re-test at the price flip that was in line with the recent strong momentum price, it fired off a rejection candle. This signals that it wanted to move back lower and reject this major level. This was the same daily level on the 30 minute chart – see the charts below.
The other super interesting thing to note about this 30 minute chart is that after this rejection candle forms, price sells off a little bit, but does not make a strong move right away. This is really common when a market is looking to make a reversal. A lot of traders when they get into reversal trades will see that price is not going in their favor straight away, and then get nervous and do something silly like move their stops or play with their trade.
Notice on the 30-minute chart price made another attempt at moving higher. Price moved almost to the pip to the same daily price flip resistance, before then reversing. I discuss the anatomy of a reversal in a lot of depth and how you should be using them in your trading in my most recent lesson at:
How to Read a Price Action Market Reversal & Take Advantage When it Happens
Daily Silver Chart
Daily Silver Chart
30 Minute Silver Chart

Related Forex Trading Education


Leave a Reply