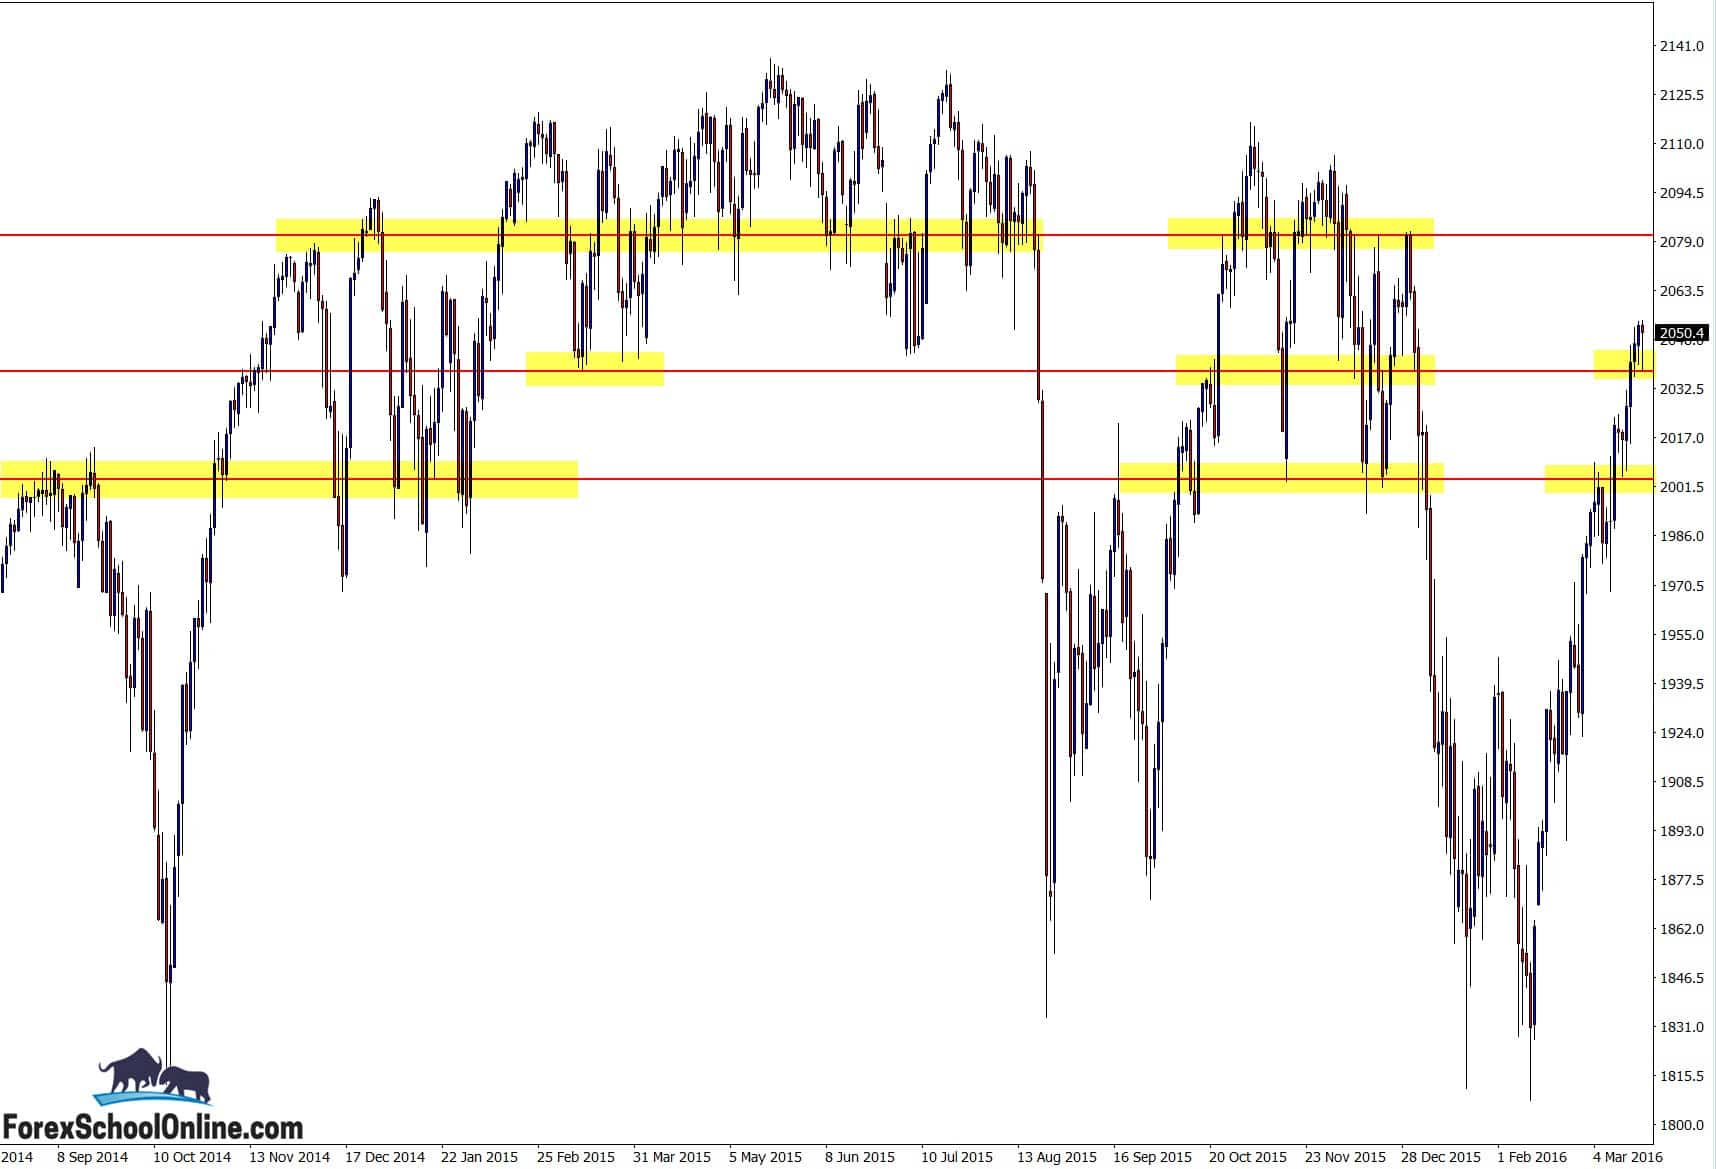
Price on the US500 or what is often known as the S&P 500 is now in a strong short-term trend higher after price had been ranging and trading in a sideways pattern for months on end.
Price in this market has been in a severe chop for a long time now with clear major highs and lows. In between this chop and sideways movement we have had at times really solid and free flowing short-term trends for traders to take advantage of and one such short-term trend is in play right now.
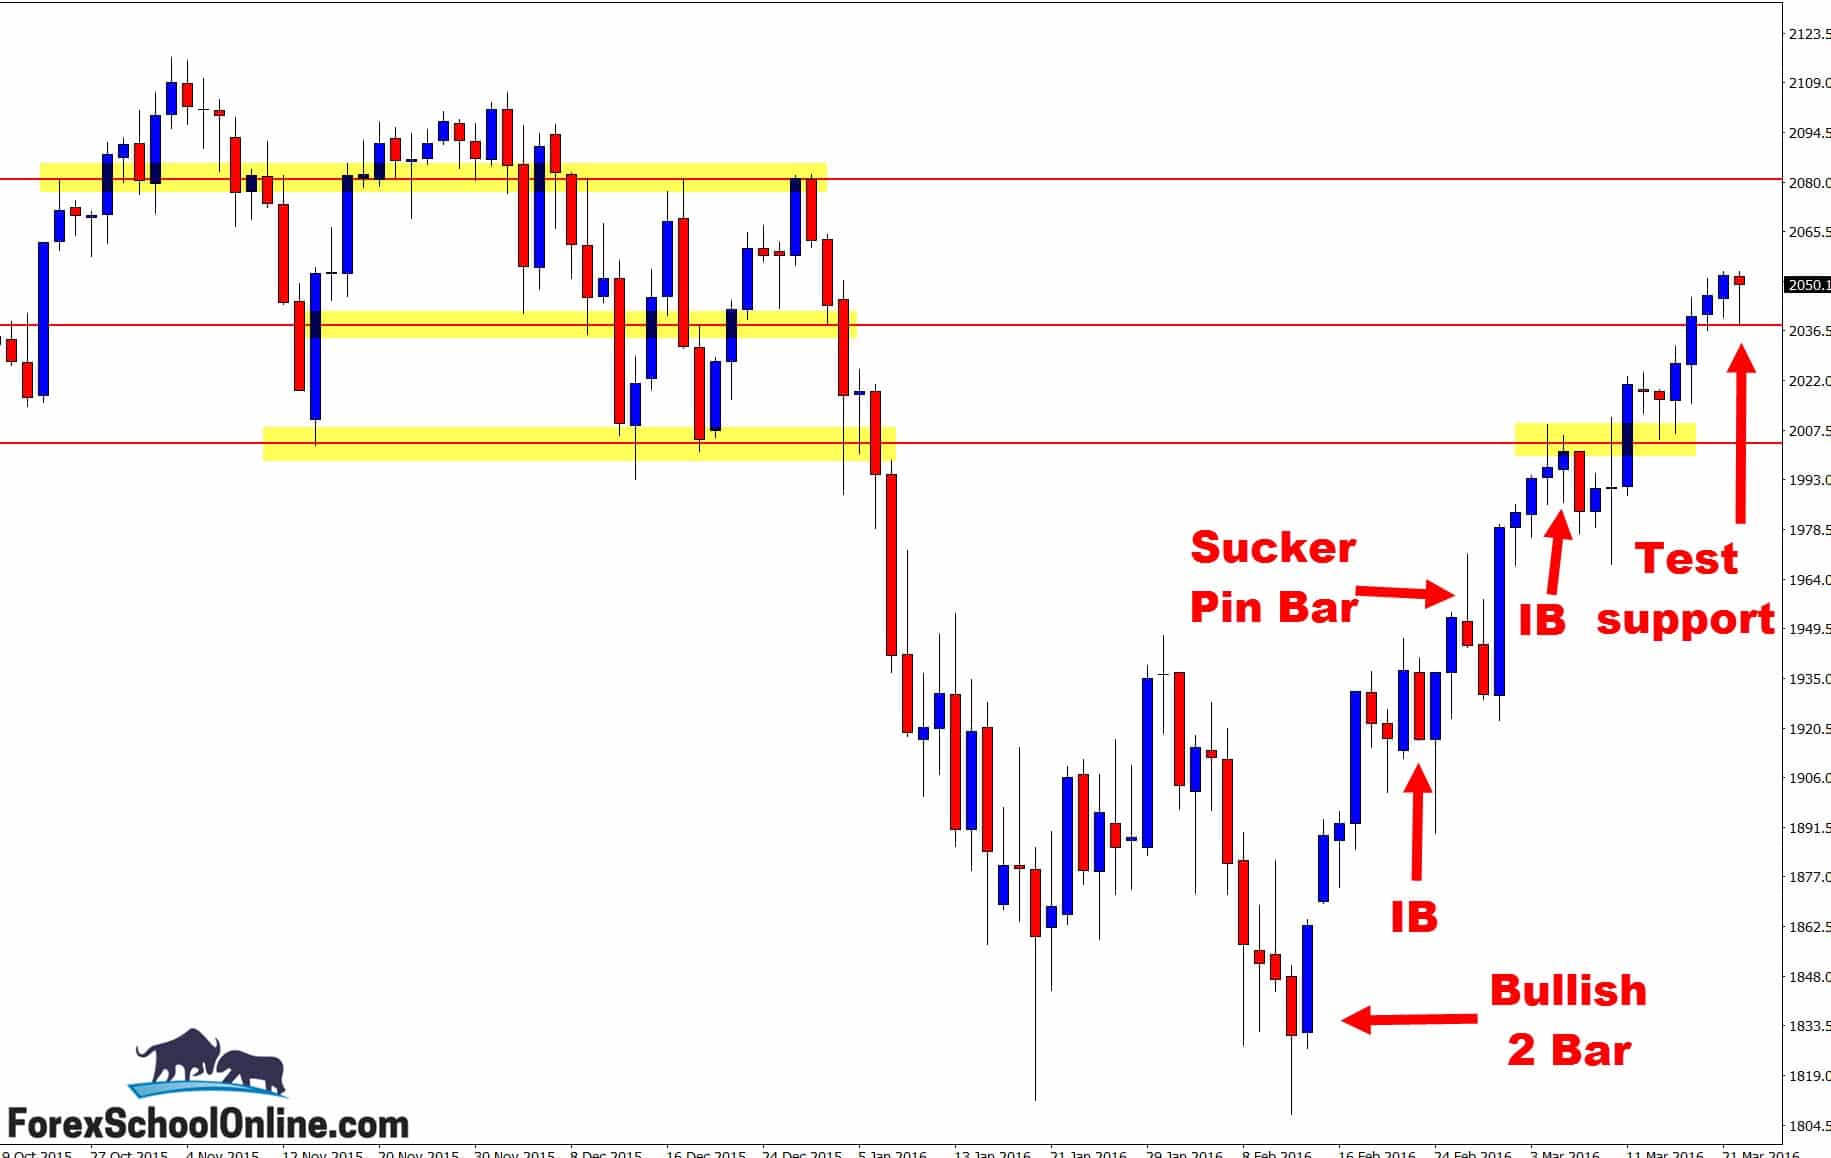
As the second chart below shows for you; from the mid way point of February price has made a very strong rally higher off the extreme range base/range low. Price action traders could have been watching this level like a hawk for a few reasons.
If the support level had broken it could have given way to a HUGE breakout lower that could have paved the way for potentially massive gains with short trades, OR as has now happened, price has found support and once again bounced off the proven level with buyers winning the day.
You will notice that this new move and new short-term strong trend higher was kicked off with a large bullish 2 bar reversal that was down at the low and rejecting the support. It was also rejecting the price flip level with the level having previously held as a major daily resistance.
The question now is – where to from here and how to play it… The trend is always our friend until it bends. In other words; keep it simple and keep making trades with the obvious and what is right in front of you until the price action story tells you otherwise.
Price action as I write this is making a test of the support level. If it can hold and continue higher, then there is a lot of space overhead to move into with the strong trend and momentum for you to use and potentially take advantage of.
Daily Chart – Zoomed Out

Daily Chart – Zoomed In

Related Forex Trading Education


Leave a Reply